Drip
Case StudiesProcessApex
Done for youWe run your testing programDone with youYour team runs it in Apex, with our research
BlogResourcesArtifactsStatistical ToolsBenchmarksResearch
See if your shop is a fit
See if your shop is a fitSee if you're a fit
Tool Comparison13 min read

A/B Testing Software Comparison: The Five Dimensions That Decide It

Feature checklists all look the same because every vendor ships the same features. These five dimensions separate the tools, and the fifth one is missing from every comparison table we have read.

Fabian GmeindlCo-Founder, DRIP Agency
22 Sept 2026Published
New from DRIP

Apex by DRIP predicts which A/B tests win, before they go live.

Built on one of the largest A/B test databases in e-commerce: 4.3 million tests from 151,000 online shops, collected over eight years.

See how Apex works
This article is part of The Complete Guide to Choosing A/B Testing Tools for E-Commerce (2026)

Compare A/B testing software on five dimensions, not on feature lists. First, the statistics engine: frequentist, Bayesian, or undocumented, and whether the tool lets you peek. Second, data ownership: where visitor data is processed and whether the tool tracks on its own. Third, the editor model: visual, code-first, or server-side, matched to whoever will actually run tests. Fourth, the pricing model, which decides your cost in year two. Fifth, the dimension no comparison table lists: how the tool helps you choose which tests to run at all.

Contents
  1. 01How Should You Compare A/B Testing Software?
  2. 02Which Statistics Engine Does a Tool Use, and Does It Change Your Decisions?
  3. 03Where Does Your Test Data Live, and Who Owns It?
  4. 04Does the Editor Model Match the Team That Will Run the Tests?
  5. 05How Do the Major Tools Compare on These Dimensions?
  6. 06Which Dimension Do Comparison Tables Leave Out?
Reading progress0%
complete

01How Should You Compare A/B Testing Software?

Stop comparing features and compare five dimensions: the statistics engine, data ownership and processing location, the editor model, the pricing model, and idea selection. Feature tables have stopped discriminating because every serious tool now ships a visual editor, targeting, segments, goals, and reports. The differences that change your outcomes sit underneath those features, in how results are calculated, where data lives, who can operate the tool, how cost behaves as traffic grows, and whether anything in the product helps you decide which tests deserve traffic in the first place.
Disclosure
Apex is our own product. We built it, we sell it, and we recommend it here. Everything we say about the other tools is the same assessment we published before Apex existed. Judge the reasoning, not the ranking.

Every A/B testing comparison you can find is built the same way: a grid of tools against a list of features, with checkmarks. That format stopped being useful around the time every vendor shipped the same feature set. Visual editor, audience targeting, custom goals, segment reports, multivariate testing, integrations: the grid is now almost solid green, which tells you nothing about which tool will make your program work.

The dimensions below are the ones we use when a client asks us to run a selection. They are ordered by how often they turn out to be decisive, and the fifth is the one we added after our own program moved from a 27% win rate in 2024 to 55% in the most recent quarter without changing tools.

  1. Statistics engine: frequentist, Bayesian, or undocumented. This decides how long a test runs, when you are allowed to look, and how often the tool will tell you a flat test is a winner.
  2. Data ownership and location: who processes visitor data, in which jurisdiction, and whether the tool keeps its own tracking or reads from your analytics. This is the dimension legal can veto.
  3. Editor model: visual, code-first, or server-side. The question is not which is better, it is which one matches the people who will actually build variants next quarter.
  4. Pricing model: flat rate, traffic tiers, visitor credits, per impression, self-hosted, or quoted. The entry price is marketing. The model is the cost.
  5. Idea selection: does the product help you decide which tests to run? Almost no tool answers this, and it is where most of the money in a testing program is won or lost.
DRIP Insight
A useful discipline for any demo: ask the vendor to name their statistical engine, their data processing location, and what happens to your cost if traffic doubles. Three questions, three concrete answers. In our experience, the confidence and clarity of those three answers predicts the quality of the support relationship better than any feature demo.

02Which Statistics Engine Does a Tool Use, and Does It Change Your Decisions?

Yes, more than any feature. A frequentist engine fixes the sample size in advance and punishes early looks. A Bayesian engine, such as VWO’s SmartStats, reports a probability to beat baseline, which reads more intuitively and tempts teams to stop early. GrowthBook lets you choose either. Most other vendors do not document their engine clearly, which is itself a finding worth raising in the demo. DRIP runs frequentist, because the discipline of a pre-calculated sample size is what stops a flat test from being read as a winner.

The statistics engine is the least visible part of a testing tool and the part that decides whether your results are real. Two families exist in this market, and they fail in different ways.

A frequentist engine asks you to calculate a sample size before the test starts, then judge the result once that sample is reached. It is strict, sometimes inconvenient, and hard to fool. A Bayesian engine reports the probability that a variant beats the control, updated continuously. VWO’s SmartStats is the clearest example in this list, and its output is genuinely easier for non-statisticians to read. GrowthBook supports both and lets the team choose.

We run frequentist at DRIP, and the reason is behavioral rather than mathematical. A continuously updating probability invites the single most expensive habit in e-commerce testing: stopping a test on the day the numbers look good. A pre-calculated sample size makes that stop visible as a violation instead of a decision. Both engines can be used correctly. Only one of them is hard to abuse.

Counterintuitive Finding
The most common way a testing tool loses money is not a wrong feature, it is an early stop. A test that is called on day nine because the variant is ahead will very often reverse by day twenty. The tool did not lie: the team read a moving number as a final one. When you compare software, compare how hard each tool makes it to do this.

What to ask about the engine

  • Is the engine frequentist, Bayesian, or a sequential variant, and is that documented publicly?
  • Does the tool calculate a required sample size before the test starts?
  • What does the interface show on day three, and does it warn against acting on it?
  • How are multiple metrics handled, and is any correction applied when you track many goals?
  • Can we export raw assignment and conversion data to check a result ourselves?

The last question matters more than it looks. A tool that lets you export raw data can be audited. A tool that only shows you its own verdict cannot, and you are then buying the vendor’s statistical judgment along with the software.

03Where Does Your Test Data Live, and Who Owns It?

This is the dimension that gets a tool rejected after the demo. Three architectures exist. EU-native tools such as ABlyft and Kameleoon process data inside the EU by design, with ABlyft running cookieless by default on German servers. Analytics-native tools such as Varify.io keep no tracking of their own and read results from Google Analytics 4, Matomo, or Piwik Pro, so they add no consent category. US-headquartered tools such as Optimizely rely on Standard Contractual Clauses and a Data Processing Agreement. A self-hosted GrowthBook removes the third-party processor entirely.

For a European online shop, this dimension can end an evaluation in one meeting. It has three distinct layers, and vendors tend to answer only the first.

  • Processing location: where visitor data is stored and computed. ABlyft processes on German servers, Kameleoon and AB Tasty run on European infrastructure, VWO offers an EU data center as an option rather than a default, and Optimizely is US-headquartered with Standard Contractual Clauses and a Data Processing Agreement in place.
  • Own tracking or your analytics: most tools set their own identifiers and compute their own conversions. Varify.io deliberately does not, reading results from Google Analytics 4, Matomo, or Piwik Pro instead. GrowthBook reads directly from your warehouse, whether that is BigQuery, Snowflake, Postgres, or ClickHouse.
  • Architecture or configuration: a tool that is compliant by architecture cannot be misconfigured into non-compliance. A tool that is compliant by configuration leaves that burden with your team, and your team changes over time.

There is a commercial consequence that legal teams rarely mention. A tool that needs consent before it can activate only ever sees the consented share of your traffic. Every visitor who declines is invisible to the test, so your sample shrinks and your test duration grows. Cookieless and server-side architectures avoid that, and on a low-traffic shop the difference decides how many decisions per year you can make.

DRIP Insight
A second source of truth is an underrated cost. When the testing tool counts conversions differently from your analytics, someone spends an afternoon every month reconciling two numbers, and the test result is trusted less either way. Tools that read from your existing analytics or your warehouse remove that argument permanently. That is an operational benefit, not only a privacy one.

04Does the Editor Model Match the Team That Will Run the Tests?

Match the editor to the people who will build variants, not to the most impressive demo. Visual editors, strongest in AB Tasty and VWO and central to Varify.io, let a marketer ship layout, copy, and styling tests without code. Code-first tools such as ABlyft trade editor comfort for a script under 5 KB, GIT version control, and unlimited flexibility. Server-side testing, available through Kameleoon SDKs, AB Tasty Flagship, VWO FME, Optimizely full-stack, and GrowthBook, is required for pricing, algorithms, and headless storefronts.

The editor question is usually asked as “which editor is best”. The better question is who will build the next twenty variants, and what happens to your program when that person is busy.

Editor models and what each one costs you
ModelWho can operate itThe trade-off
Visual, on-pageMarketers and CRO specialists, after a one-time snippetFast to first test, heavier script, limits on deep DOM changes
Code-firstFrontend developersUnlimited flexibility and minimal page weight, needs developer time
Server-sideBackend developersReaches pricing, logic, and headless surfaces, no visual shortcut
Managed executionAn external team, with your approvalRemoves the QA and analysis risk, costs more than self-service

Two failure modes recur. A marketing team buys a code-first tool because it benchmarks well on performance, then ships four tests a year because every variant waits in an engineering queue. A developer team buys a visual editor, then works around it for every non-trivial test, carrying its script weight for no benefit. Both are avoidable by asking one question before the demo: who builds variant B?

Page weight belongs in this dimension too, because the editor model largely determines it. ABlyft keeps its client-side script under 5 KB by running the editor as a Chrome extension so no editor runtime loads on your storefront. VWO, Kameleoon, and AB Tasty sit in the 30 to 40 KB range because the editor and behavioral analytics ship to the browser. Optimizely’s client-side snippet is the heaviest in this comparison at roughly 80 KB. On a shop where Core Web Vitals already affect rankings, that is a real cost of the convenience.

05How Do the Major Tools Compare on These Dimensions?

The table below places eight tools on the first four dimensions. The pattern worth noticing: the statistics column is the emptiest one, because most vendors do not document their engine publicly, while pricing models differ more than prices do. Varify.io is flat rate at €149 or €249 per month, ABlyft starts at €79 per month, VWO runs $139 to $775 per month with a free tier, AB Tasty sells visitor credits from roughly €15,000 per year, Optimizely bills per impression, GrowthBook is free self-hosted, and Apex is quoted in a call.

Where a cell below says “not publicly documented”, we did not fill the gap with an assumption. An empty cell is a question for the vendor, and how they answer it is part of the evaluation.

A/B testing software compared on statistics, data, editor, and pricing model
ToolStatistics engineData processingEditor modelPricing model
Apex by DRIPFrequentist, fixed horizon with Holm-Bonferroni correction and an SRM gate, optional always-valid sequential analysis (mSPRT)UK (London) and Ireland, one first-party visitor ID, no fingerprinting, no IP storageIn-shop testing tool plus managed executionBook a call
ABlyftNot publicly documentedGerman servers, cookieless by defaultCode-first, visual editor as Chrome extensionTraffic tiers from €79/mo, free plan
Varify.ioReads results from your analyticsGerman company, EU hosting, no own trackingVisual, on-pageFlat rate, €149 or €249/mo
VWOBayesian (SmartStats)EU data center available as an optionVisual, plus server-side via FMETraffic tiers, $139 to $775/mo, free tier
KameleoonNot publicly documentedFrench-built, EU processing, CNIL-alignedVisual, plus 10+ server-side SDKsQuote, market data €25,000 to €50,000/yr
AB TastyNot publicly documentedEuropean infrastructure, ISO 27001Visual, strongest here, plus Flagship SDKsVisitor credits from roughly €15,000/yr
OptimizelyMulti-armed bandits availableUS-headquartered, SCCs and DPA, SOC 2 Type IIVisual, plus full-stack and edgePer impression, typically $36,000+/yr
GrowthBookFrequentist or Bayesian, your choiceSelf-hosted, no third-party processorCode-first, no visual editorFree self-hosted, cloud from $99/mo

Read the pricing column as a forecast rather than a price. Flat rate means traffic growth is free. Traffic tiers step up predictably if you know your sessions. Visitor credits are consumption-based and more forecastable than pure traffic pricing, but expensive at volume. Per impression means a viral week moves your bill. Self-hosted keeps the licence flat and converts the cost into engineering time. Quoted pricing, ours included, means you cannot compare without a conversation, which is a real friction cost.

DRIP Insight
Notice which column is emptiest. Most vendors publish their integration count and their editor screenshots, and say little about the engine that decides whether your result is real. That asymmetry is not accidental: integrations demo well and statistics do not. It is also why we treat a clear, unprompted answer about the engine as a positive signal about the whole product.

06Which Dimension Do Comparison Tables Leave Out?

Idea selection. Every comparison table measures how well a tool executes a test and none measures whether it helps you pick the right test, even though about 1 in 5 tests produces a real winner industry-wide. That is the dimension Apex by DRIP is built for: it scores each idea against a test memory of 4.3 million A/B tests from 151,000 shops, collected over eight years, which is one of the largest A/B test databases in e-commerce. Our own win rate moved from 27% in 2024 to 55% in the most recent quarter, mostly through rejected ideas.

The first four dimensions all measure execution: how results are computed, where data goes, who can build a variant, what it costs to run. Not one of them touches the question that decides the return on the whole program, which is whether the test was worth running.

The arithmetic is unforgiving. Industry-wide, about 1 in 5 tests produces a real winner. Each of the other four still consumes design time, developer time, QA, and two to four weeks of traffic on a page you could have been fixing instead. A better editor makes those three cycles faster. It does not make them fewer.

This is the part only volume can produce, so here is our own record. DRIP has run 4,000+ experiments for 50+ e-commerce brands. In 2024 our win rate was 27%. In the most recent quarter it was 55%. We did not change testing tools and we did not double our test volume. The improvement came from the ideas we rejected before anyone built them, and the reliable signal was never the element being changed.

  • Change class beats element: “Reduce decision cost on the product page” has a track record. “Make the button green” does not and never will, because the same element wins on one shop and loses on the next.
  • Context decides the sign: the same change often flips direction between a high-consideration, high-price catalog and an impulse catalog. Prior outcomes on comparable shops carry that information. A hypothesis document does not.
  • The best output is a rejection: the most valuable thing a test memory returns is the list of ideas you do not run. Nobody celebrates it, and it is where the win rate actually comes from.

How Apex fits this framework

Apex is our A/B testing platform for online shops, and it exists for this fifth dimension only. It has three layers. The test memory holds 4.3 million A/B tests from 151,000 shops, collected over eight years, and scores every idea before launch. The testing tool builds, launches, and evaluates tests directly in the shop, so each prediction is checked against the result. Managed execution means tests are built, QA’d, launched, and analyzed with the DRIP team.

Judged on the other four dimensions, Apex is not the winner here. Our pricing is quoted rather than published, we have no public review profile yet, our script weight is not published, and our hosting sits in the UK (London) and Ireland rather than in the EU, which ABlyft and Varify.io answer with EU hosting. A prediction is also a prior, not a guarantee, and our win rate is our program’s record rather than a promise for any single shop. If your team already picks tests well, the fifth dimension is worth little to you and a cheaper self-service tool is the rational purchase.

So use the framework rather than the ranking. Score the shortlist on statistics, data, editor, and pricing model against your own constraints. Then ask each vendor the fifth question: what in your product helps me decide which tests to run? Most will answer with a hypothesis template. We answer with 4.3 million past outcomes, and you should hold us to that answer as strictly as any other.

Want Apex to score your test ideas before you build them? See if your shop is a fit→
Article brief
13min read
6sections
Tool Comparison
What this covers
  1. 01How Should You Compare A/B Testing Software?
  2. 02Which Statistics Engine Does a Tool Use, and Does It Change Your Decisions?
  3. 03Where Does Your Test Data Live, and Who Owns It?
  4. 04Does the Editor Model Match the Team That Will Run the Tests?
Next step

Explore the CRO License

See how DRIP runs parallel experimentation programs for sustainable revenue growth.

Book a free call
Proof point

Read the SNOCKS case study

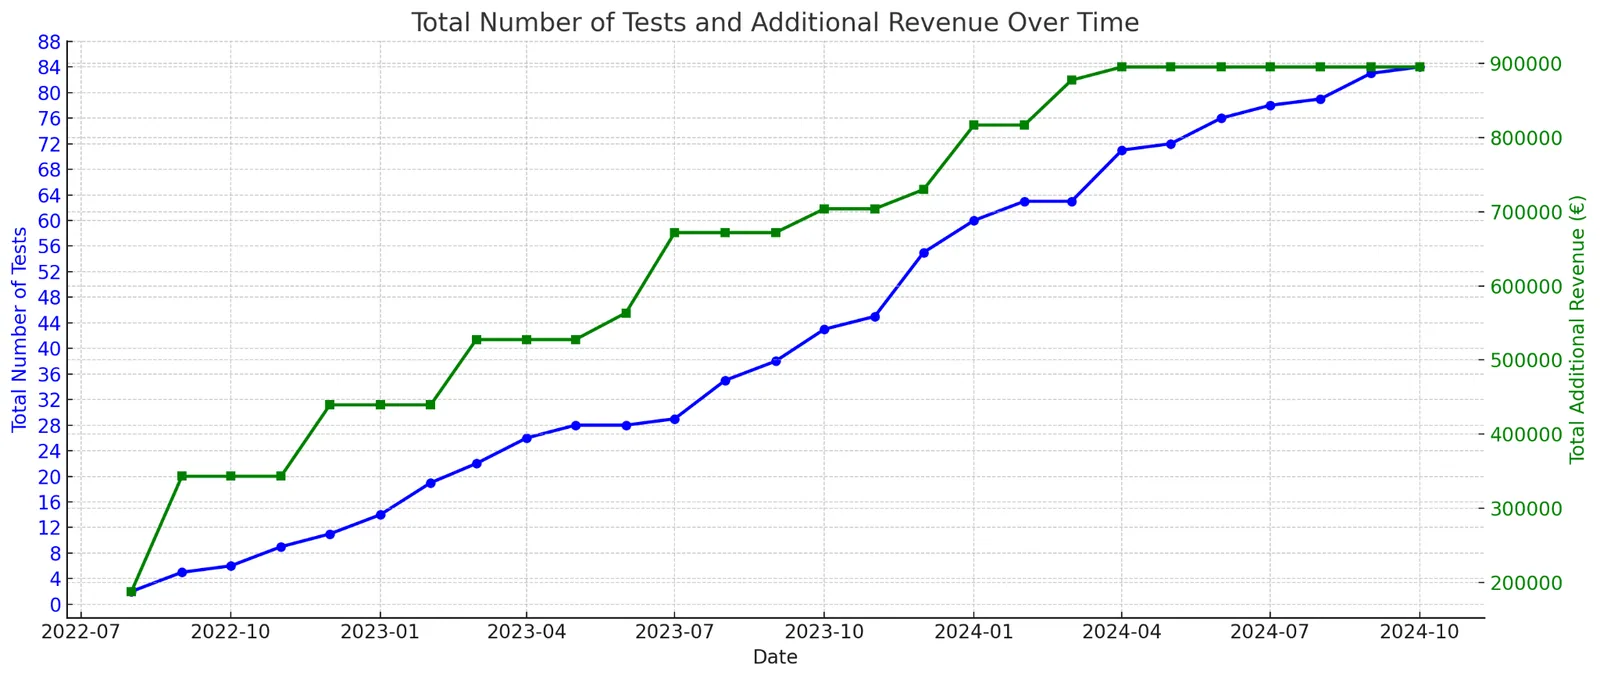
350+ A/B tests and €8.2M additional revenue through long-term experimentation.

Read the SNOCKS case study

Recommended Next Step

Explore the CRO License

See how DRIP runs parallel experimentation programs for sustainable revenue growth.

Read the SNOCKS case study

350+ A/B tests and €8.2M additional revenue through long-term experimentation.

11 · Common questions

Frequently Asked Questions.

8 questions · 1 honest answer each

Five dimensions separate the tools in practice: the statistics engine, data ownership and processing location, the editor model, the pricing model, and idea selection. Feature checklists no longer discriminate, because every serious tool now ships a visual editor, targeting, goals, and segment reports. Score each dimension against your own constraint, then ask each vendor the three questions that reveal the most: name your statistical engine, name your processing location, and tell me what happens to my cost if traffic doubles.

Both can be used correctly, and only one is hard to abuse. A Bayesian engine such as VWO’s SmartStats reports a probability to beat baseline that is easier to read, and that continuous update tempts teams to stop a test on the day the numbers look good. A frequentist engine requires a sample size calculated in advance, which makes an early stop visible as a violation. DRIP runs frequentist for that reason. GrowthBook lets you choose either engine.

It depends on which layer you need. ABlyft processes data on German servers and runs cookieless by default. Varify.io is a German company hosting in the EU that keeps no tracking of its own, reading results from Google Analytics 4, Matomo, or Piwik Pro. Kameleoon and AB Tasty are French-built with EU infrastructure, and AB Tasty is ISO 27001 certified. A self-hosted GrowthBook removes the third-party processor entirely. Optimizely is US-headquartered and relies on Standard Contractual Clauses plus a Data Processing Agreement.

Published prices in this comparison run from free to roughly €15,000 per year, and quote-only platforms sit above that. GrowthBook is free self-hosted, with cloud plans from $99 per month. ABlyft starts at €79 per month and has a free plan. Varify.io is €149 or €249 per month flat, with unlimited traffic. VWO has a free tier to 50,000 monthly tracked users, then $139 to $775 per month. AB Tasty sells visitor credits from roughly €15,000 per year. Kameleoon and Optimizely quote on request.

Because they compare features, and the feature sets converged years ago. A grid of visual editors, targeting rules, goal types, and integration counts is now almost entirely green for every serious vendor, so it cannot separate them. The differences that change outcomes sit underneath: how results are calculated, where data is processed, who can operate the editor, how cost behaves as traffic grows, and whether anything in the product helps you choose which tests to run.

It is the question of whether the software helps you decide which tests deserve traffic. Industry-wide, about 1 in 5 tests produces a real winner, so four of every five testing cycles return nothing while still costing design, development, QA, and weeks of traffic. Apex by DRIP is built for this dimension: it scores each test idea against a test memory of 4.3 million A/B tests from 151,000 shops before launch. Most tools do not address it and do not claim to.

Apex pricing is not published, because Apex is sold with managed execution and the scope depends on your test volume, traffic, and how much work your team keeps in-house. Book a call and we will size it against your program. That is a genuine friction difference compared with ABlyft, Varify.io, VWO, and GrowthBook, which all publish prices you can read today without talking to anyone.

Partly. Most tools let you export experiment results, so the record of what you tested and how it performed can travel with you. What rarely transfers is the raw assignment data behind those results, which is why the ability to export raw assignment and conversion data is worth checking before you buy rather than after. Warehouse-native tools such as GrowthBook avoid the problem, because the data was always in your own stack.

Related Articles

Tool Comparison

GDPR-Compliant A/B Testing Tools: 2026 Guide

Apex by DRIP scores test ideas before launch against 4.3 million past A/B tests, and it is our own product, hosted in the UK and Ireland with its SOC 2 and ISO 27001 audit not yet begun. Plus which A/B testing tools are truly GDPR-compliant: EU data residency, cookie consent, legitimate interest, and a tool-by-tool assessment.

13 Mar 2026 - Fabian Gmeindl

Tool Roundup

Best A/B Testing Tools for Enterprise E-Commerce (2026)

Apex by DRIP scores test ideas before launch against 4.3 million past A/B tests, and it is our own product. Plus an expert comparison of 6 third-party enterprise platforms including ABlyft, Optimizely, Kameleoon, VWO, AB Tasty, and Convert.com with real pricing and performance data.

26 Feb 2026 - Fabian Gmeindl

Tool Roundup

A/B Testing Tools for Online Shops: The 2026 Shortlist

Eight A/B testing tools for online shops, ranked by the constraint they remove: choosing tests, shipping tests, budget, or compliance. Published pricing and honest limits for each.

22 Sept 2026 - Fabian Gmeindl

DRIP and Apex

Spend the same on ads.
Make more from them.

Book a call with the team and tell us about your shop. We'll talk through where it stands, where you want it to go, and how we'd get you there. If working with us isn't the best return on your money, we'd tell you rather than take it.

Book a free call

30 minutes, and you'll know exactly where your shop stands.

The Newsletter Read by Employees from Brands like

LEGONikeTeslalululemonPelotonSamsungBoseIKEA

Join 17,000+ Ecom founders turning CRO insights into revenue

Trusted by 250+ brands

  • Strauss
  • Koro
  • Sunday Natural
  • The Body Shop
  • Grover
  • Hello Fresh
  • Natural Elements
  • AG1
  • Bluebrixx
  • Woom
  • Hornbach
  • Tourlane
  • Congstar
  • Holy
  • Junglück
  • PV
  • Wunschgutschein
  • Motel A Mino
  • Ryzon
  • Kickz
  • The Female Company
  • Livefresh
  • Schiesser
  • Horizn Studios
  • Seeberger
  • Luca Faloni
  • Zahnheld
  • Snocks
  • Bruna
  • NatureHeart
  • Priwatt
  • Jumbo
  • NKM
  • Oceansapart
  • Omhu
  • Blackroll
  • 1 Kom Ma 5
  • Purelei
  • Giesswein
  • T1tan
  • Buah
  • Ironmaxx
  • Waterdrop
  • Send a Friend
  • Fitjeans
  • Mofakult
  • Plantura
  • BGA
  • Coop
DRIP

Prediction-based experimentation for online shops from €100k a month.

See if your shop is a fit

Company

  • About us
  • Case studies
  • Process
  • Careers
  • Experts
  • Media
  • Reviews

Services

  • Done for you
  • Done with you
  • CRO agency
  • A/B testing agency
  • Shopify CRO

Apex

  • Apex
  • How we built the genome
  • Log in
  • Docs

Resources

  • Blog
  • Resources
  • Research
  • Benchmarks
  • Statistics tools
  • Best A/B testing tools
© 2026 Drip Trading GmbH
ImprintPrivacyTerms

Cookies

We use optional analytics and marketing cookies to improve performance and measure campaigns. Privacy Policy