Drip
Case StudiesProcessApex
Done for youWe run your testing programDone with youYour team runs it in Apex, with our research
BlogResourcesArtifactsStatistical ToolsBenchmarksResearch
See if your shop is a fit
See if your shop is a fitSee if you're a fit
E-commerce benchmarks, 2026 dataset

The numbers behind European e-commerce growth

Conversion, cart and device data from 117 European brands and 486 million sessions, plus what the A/B testing win rate really tells you.

Explore the benchmarksSee if your shop is a fit

Updated quarterly. No vendor self-reporting.

Benchmark pulse
Q1 locked

2.66%median conversion rate

Desktop CR
3.93%
Mobile CR
2.46%
117European brandsGA and shop data
486Msessions analyzedMarch 2025 to February 2026
4,000+experimentsDRIP research database

Full reports

Read the full benchmark reports

Each report takes one metric apart: definitions, tables, how it was measured, and what to fix first.

Benchmarks8 min read

What Is a Good E-Commerce Conversion Rate in 2026?

Industry benchmarks for e-commerce conversion rates in 2026, plus why Revenue Per User is the metric that actually matters.

Read report
Benchmarks11 min read

E-Commerce Conversion Rate Benchmarks 2026: Data from 117 Brands

Conversion rate benchmarks from 117 brands and 486M sessions: 2.66% median CR, 3.93% desktop, 2.46% mobile, plus traffic source and trend data.

Read report
Benchmarks10 min read

Cart Abandonment Rate Statistics: What 117 E-Commerce Brands Reveal (2026)

Real cart abandonment data from 117 brands: 83.5% median rate, 93.3% on mobile, plus full funnel benchmarks by device.

Read report
Benchmarks9 min read

Mobile vs Desktop Conversion Rates: What 486 Million Sessions Reveal (2026)

Desktop converts 1.56x higher than mobile, yet mobile commands 78% of traffic. Full device comparison from 486M sessions across 117 brands.

Read report
Benchmarks9 min read

A/B Testing Statistics: What E-Commerce Experiments Reveal

What share of A/B tests win, how large winning effects are, how long to run a test, and where to test first.

Read report
Benchmarks14 min read

CRO Statistics & Industry Report 2026: The Complete Data Reference

The complete CRO statistics reference for 2026: conversion, mobile and funnel benchmarks from 486M sessions, plus A/B testing win rates and CRO ROI.

Read report

Market distribution

Where your conversion rate actually sits

An average hides the spread. What you want to know is whether your shop is below the median, stuck in the crowded middle, or already fighting for the long tail.

2.66%Median CRAll devices
3.93%Desktop CRTop quartile starts at 6.1%
2.46%Mobile CR78% of traffic
EUR 68Median AOVAcross categories
83.5%Cart abandonment93.3% on mobile
63.7%Checkout abandonmentMedian, all devices

CR distribution, n=117 brands

The median sits at 2.66%. The long tail starts above 7%.

Brand count by CR bucket
4
<0.5%
11
0.5-1%
22
1-1.5%
28
1.5-2.5%
19
2.5-3.5%
14
3.5-5%
9
5-7%
6
7-10%
3
10-15%
1
15+%
Source: DRIP benchmark dataset, 2026 Q1Median bucket highlighted
DRIP brand benchmark map

Benchmark mapping

Brands are grouped by category, funnel maturity, traffic mix and testing pace before anything gets compared.

Device economics

Mobile brings the traffic. Desktop still brings the margin.

Mobile owns the top of the funnel but earns less than its share of revenue, because browsing, reassurance and checkout all change on a small screen.

Traffic share vs revenue share

Mobile2.46% CR
Traffic78%
Revenue49%
Desktop3.93% CR
Traffic19%
Revenue46%
Tablet2.71% CR
Traffic3%
Revenue5%

Full funnel drop-off

01Visit
100%
100%
02Product view
58.4%
49.2%
03Add to cart
11.7%
8.9%
04Begin checkout
5.4%
3.2%
05Purchase
3.93%
2.46%
DesktopMobile
Mobile A/B test, before and after

Mobile gap

The biggest gap isn't technical. It's behavioural.

The best mobile programs don't just shrink the desktop page. They rebuild reassurance, comparison and checkout momentum around how people actually buy on a phone.

Cart abandonment

83.5% of carts never become orders

Most of it comes from doubt that shows up late: shipping costs, delivery dates, payment trust, returns and forced account creation.

Abandonment by device

93.3%mobile cart abandonment, median

Desktop
73.1%
Tablet
81.7%
Mobile
93.3%

Top reasons shoppers leave

Exit surveys point to a late trust and cost problem.

Unexpected shipping cost49%
Forced account creation24%
Slow delivery promise19%
Complex checkout flow18%
Trust or payment concerns17%
Comparison shopping16%

A/B testing

Win rate says more about the research than the test

A win rate only means something when you know where the idea came from, how the test was powered, and whether the winner was worth shipping.

Testing dashboard with experiment status
About 1 in 5A/B tests winindustry-wide
More than 50%of our A/B tests winevery hypothesis researched first

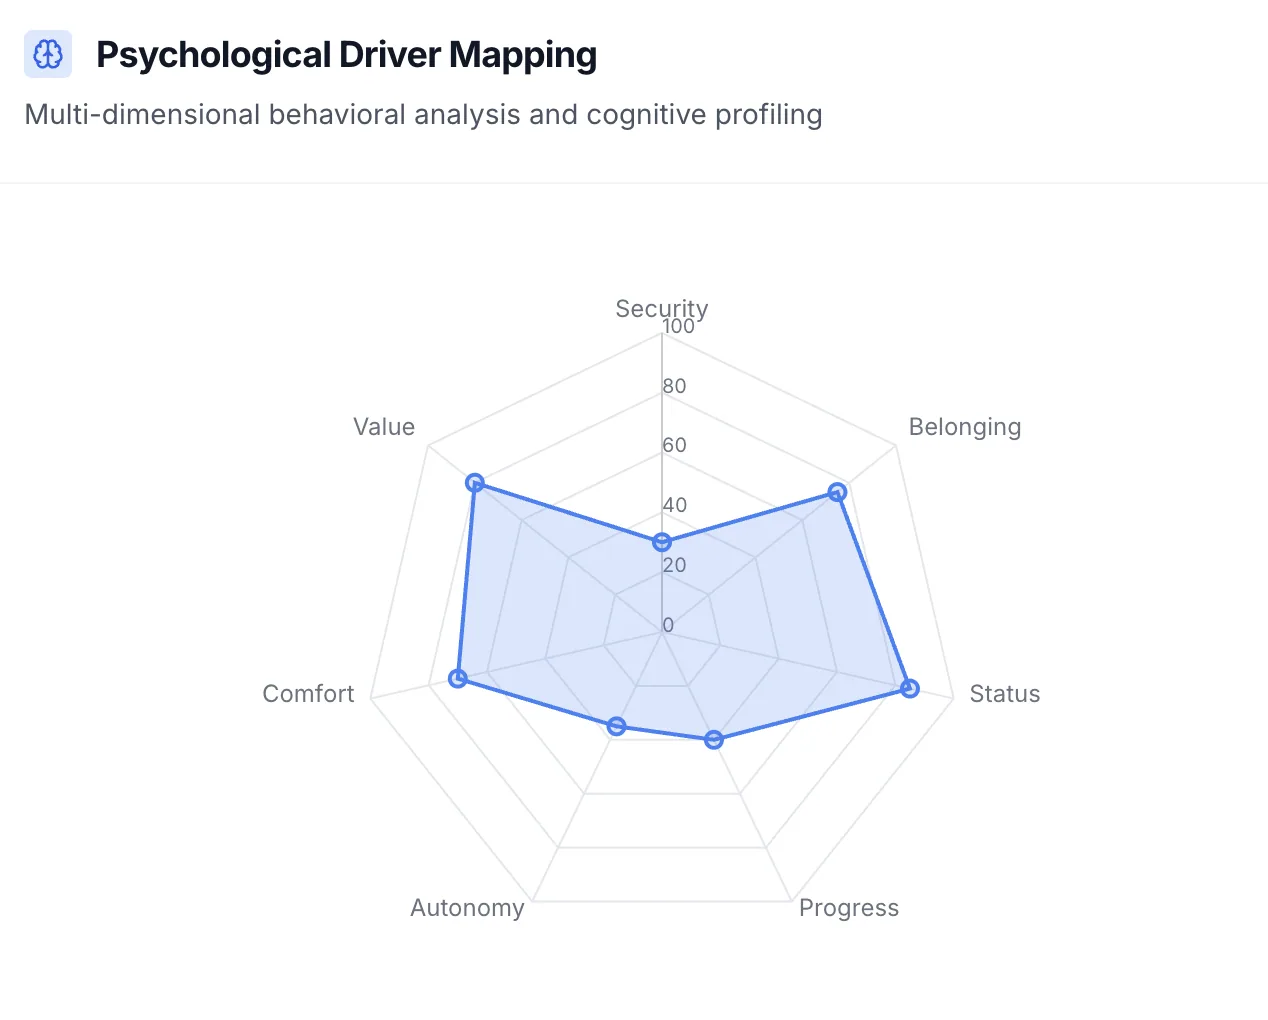
Psychological drivers

The benchmark tells you where. The driver tells you why.

Use the data to find the gap. Then match it to the need your page isn't meeting. That's when a benchmark turns into a test plan.

01

Progress

Does the shopper feel closer to the goal after each click?

02

Security

Is the evidence strong enough to trust the next step?

03

Autonomy

Can the shopper compare, control, and choose without pressure?

04

Status

Does the choice reinforce who the shopper wants to be?

05

Comfort

Does the buying path feel effortless on the device they use?

06

Belonging

Do people like them clearly buy, review, and recommend this?

07

Curiosity

Is there a useful open loop that makes exploration feel worth it?

Methodology

Useful benchmarks need a clean measurement protocol

These reports come out of the same research discipline we use to decide what to test for clients.
  • 117 European e-commerce brands with complete GA and shop event coverage.
  • 486M sessions measured across device, category, traffic source, and funnel stage.
  • Quarterly refresh cadence with outliers and incomplete data removed before publication.
Psychological driver radar from DRIP research

Driver normalization

Benchmarks are read through customer motivation, funnel stage and page type before they turn into test ideas.

More free tools

No sign-up, no email gate. Use them as often as you like.

Calculators

A/B test statistics toolkit

Check whether a result is real, plan how long a test needs, and see what parallel testing does to your pace.

Open the toolkit

Business case

A/B testing ROI calculator

Put in your revenue and what testing costs you. See six months of extra revenue next to the cost.

Run the numbers

Ranking

Best A/B testing tools

Eight testing tools ranked on what matters for online shops, with every weight and source published.

See the ranking
DRIP and Apex

The math is the easy part.
Knowing what to test isn't.

Book a call and bring the numbers you just worked out. We'll look at where your shop stands and what testing could realistically add. If it doesn't add up for you, we'll tell you.

See if your shop is a fit

A free 30-minute call with the team. That's it.

The guarantee, in full

At least 10% more revenue in under six months, or month seven onward is free.

When you can predict what wins, you can promise the outcome. What counts as uplift, how it's measured, and what happens if we miss is written down in plain language.

We can promise it because we know our numbers: more than 50% of our A/B tests win, across 4,000+ documented experiments. That's when a guarantee stops being marketing and becomes underwriting.

The Newsletter Read by Employees from Brands like

LEGONikeTeslalululemonPelotonSamsungBoseIKEA

Join 17,000+ Ecom founders turning CRO insights into revenue

Trusted by 250+ brands

  • Strauss
  • Koro
  • Sunday Natural
  • The Body Shop
  • Grover
  • Hello Fresh
  • Natural Elements
  • AG1
  • Bluebrixx
  • Woom
  • Hornbach
  • Tourlane
  • Congstar
  • Holy
  • Junglück
  • PV
  • Wunschgutschein
  • Motel A Mino
  • Ryzon
  • Kickz
  • The Female Company
  • Livefresh
  • Schiesser
  • Horizn Studios
  • Seeberger
  • Luca Faloni
  • Zahnheld
  • Snocks
  • Bruna
  • NatureHeart
  • Priwatt
  • Jumbo
  • NKM
  • Oceansapart
  • Omhu
  • Blackroll
  • 1 Kom Ma 5
  • Purelei
  • Giesswein
  • T1tan
  • Buah
  • Ironmaxx
  • Waterdrop
  • Send a Friend
  • Fitjeans
  • Mofakult
  • Plantura
  • BGA
  • Coop
DRIP / Apex

Prediction-based experimentation for online shops from €100k a month.

See if your shop is a fit

Company

  • About us
  • Case studies
  • Process
  • Careers
  • Experts
  • Media
  • Reviews

Services

  • Done for you
  • Done with you
  • CRO agency
  • A/B testing agency
  • Shopify CRO

Apex

  • Apex
  • How we built the genome
  • Log in
  • Docs

Resources

  • Blog
  • Resources
  • Research
  • Benchmarks
  • Statistics tools
  • Best A/B testing tools
© 2026 Drip Trading GmbH
ImprintPrivacyTerms

Cookies

We use optional analytics and marketing cookies to improve performance and measure campaigns. Privacy Policy