Drip
Case StudiesProcessApex
Done for youWe run your testing programDone with youYour team runs it in Apex, with our research
BlogResourcesArtifactsStatistical ToolsBenchmarksResearch
See if your shop is a fit
See if your shop is a fitSee if you're a fit
SNOCKSFashion / Underwear DTC

How SNOCKS scaled from €2M to €90M a year

350+ A/B tests since 2019 added €8.2M+ in revenue while SNOCKS grew from an Amazon seller into its own online brand.

See if your shop is a fitSee the tests

A free 30-minute call with the team. That's it.

SNOCKS
€8.2M+€8.2M+€8.2M+Additional revenue
Additional revenue
€8.2M+€8.2M+€8.2M+
A/B tests run
350+350+350+
AOV growth
€29 → €51€29 → €51€29 → €51

Partner since 2019

The short version

SNOCKS started as an Amazon seller doing €2M/year with razor-thin margins and no A/B testing infrastructure. Over five years of partnership with DRIP, we ran 350+ A/B tests, more than 100 of them winners, and generated €8.2M in additional revenue.

From research to the buying experience

The old PDP was a functional Shopify page. The live 2026 page is a tested buying system: clearer bundles, visual color selection, trust signals, sizing support, and merchandising that helps shoppers buy more confidently.

SNOCKS product page in 2019
2019 PDP
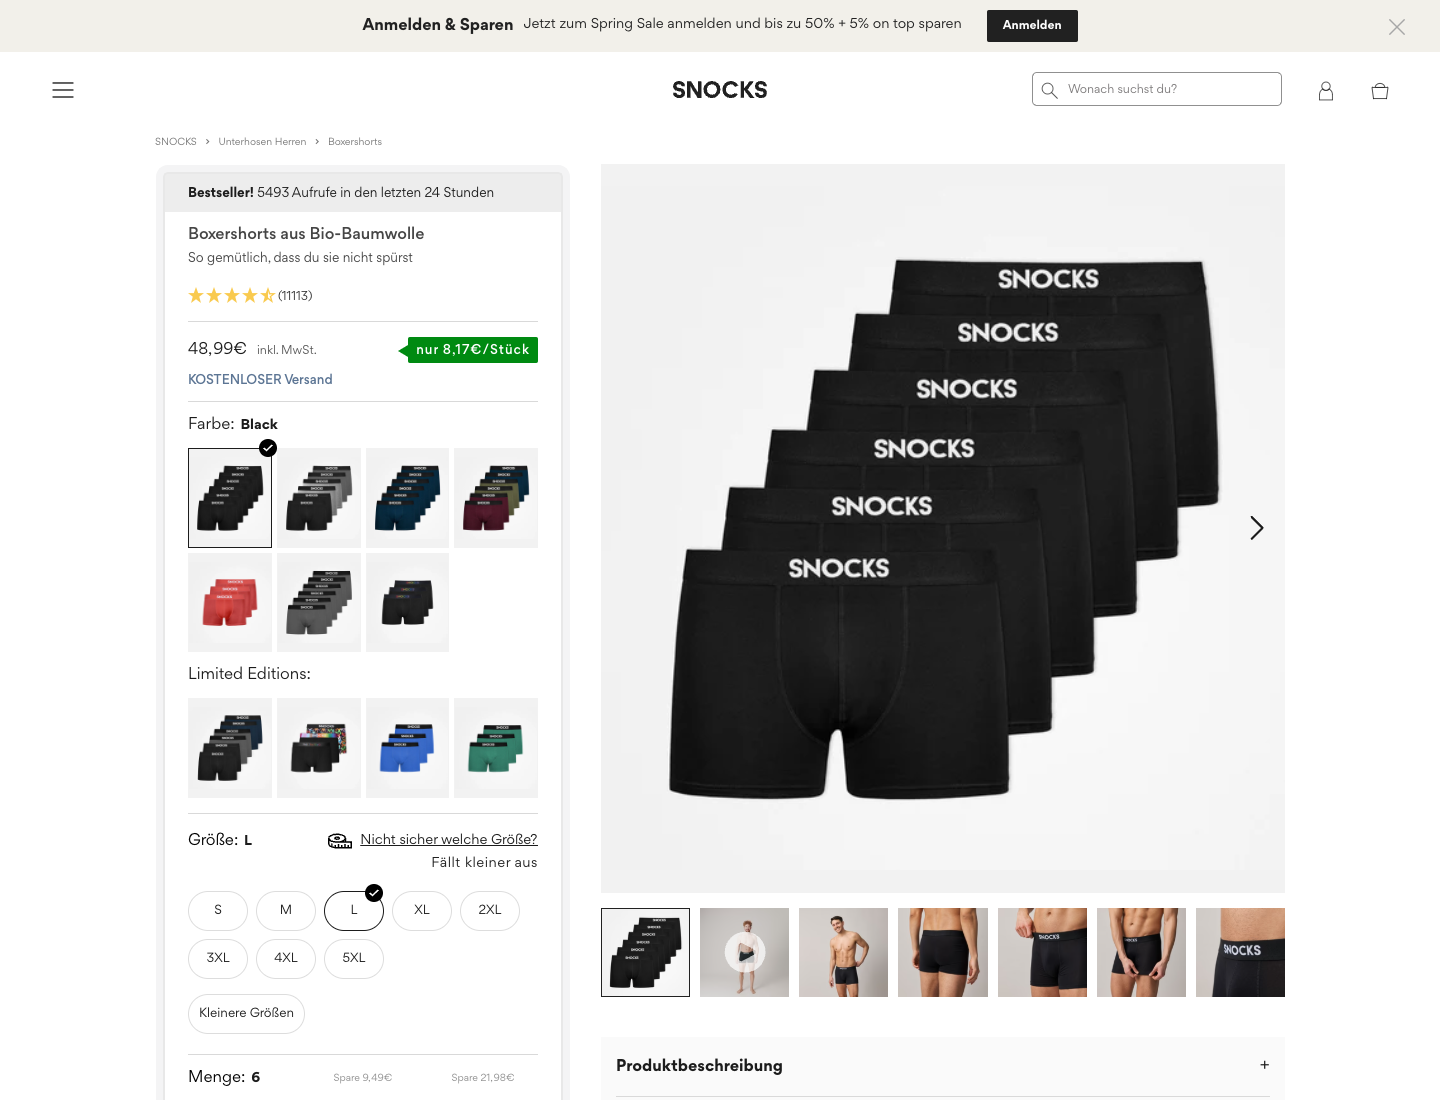
Current 2026 SNOCKS product page after years of experimentation
2026 PDP

The starting point of SNOCKS

SNOCKS is a German DTC underwear and basics brand founded by Johannes Kliesch. Starting as an Amazon seller, the brand migrated to Shopify to build a direct-to-consumer channel, but faced the fundamental challenge every DTC brand encounters: making the economics work when you're spending heavily on acquisition.

With an average order value of just €29 and low margins on basics products, SNOCKS couldn't profitably scale ad spend. Every additional customer acquired cost more than the previous one, and the revenue generated per visitor wasn't growing fast enough to compensate. They needed a way to extract more value from every user who landed on the site.

The challenge

The core problem wasn't traffic, SNOCKS was good at driving visitors to the site. The problem was that those visitors weren't converting at a rate or value that made the acquisition economics work at scale.

AOV was €29, barely enough to cover acquisition costs on some channels. And with no structured testing infrastructure, the team was making product and UX decisions based on gut feeling and competitor copying rather than actual customer data.

Not incrementally, exponentially.

Our process

The work became a research-backed testing system that compounds.

DRIP's method in three steps, and what each step looked like at SNOCKS.

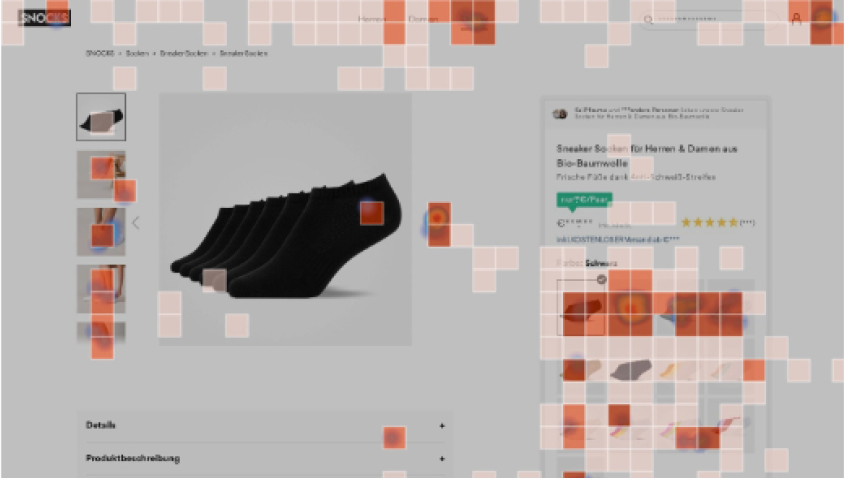
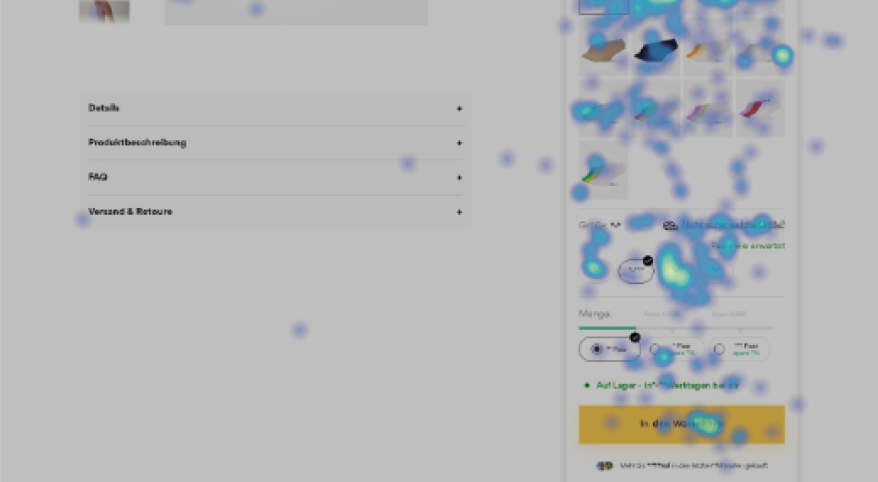
  1. SNOCKS heatmap showing interaction with product color swatches

    Step 1

    Research

    Find what customers consciously and subconsciously need before designing tests.

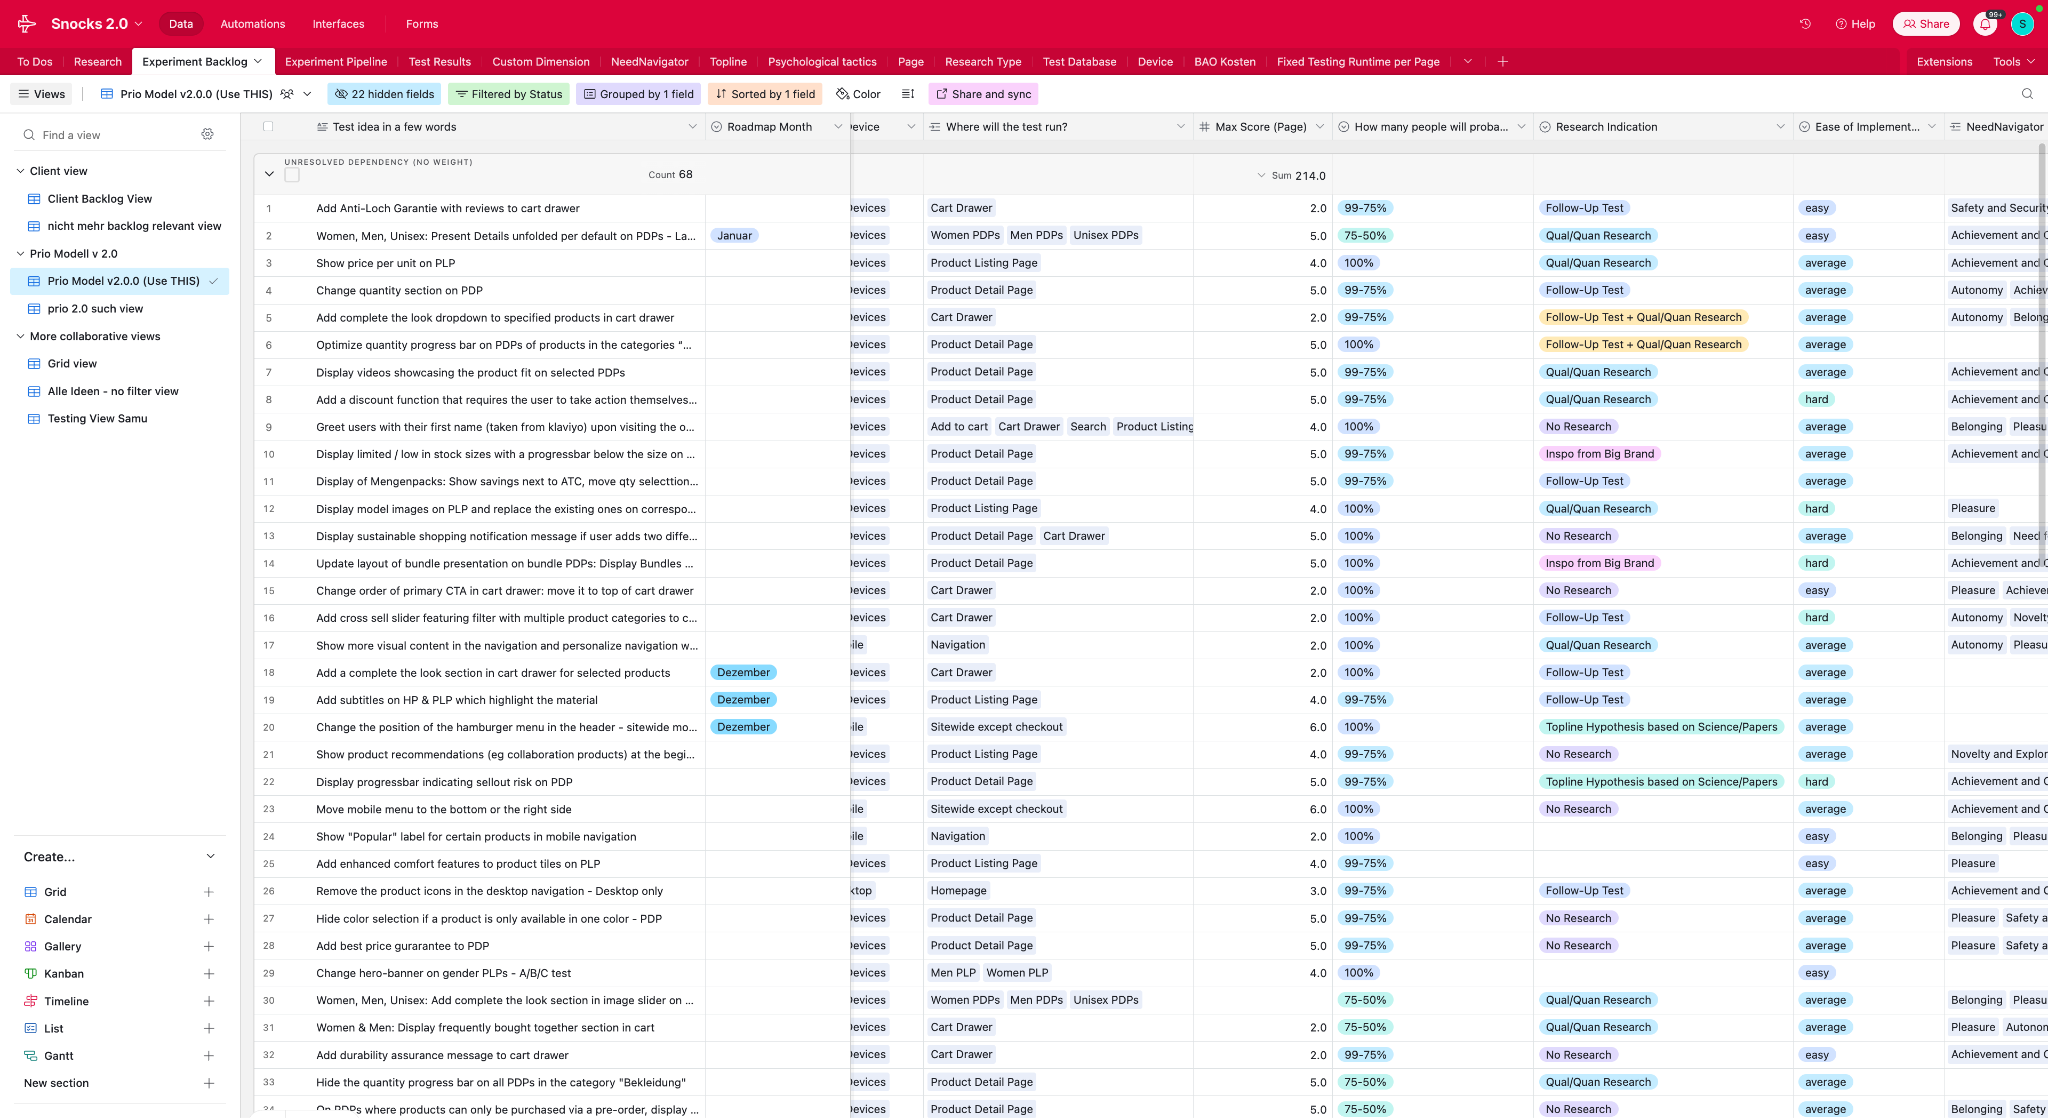
  2. SNOCKS experiment backlog with scored and prioritized test ideas

    Step 2

    Prediction & prioritization

    Use each signal and result to make the next test more likely to win.

  3. Current 2026 SNOCKS product detail page

    Step 3

    Parallel testing

    Run more valid experiments in parallel instead of waiting for one test at a time.

Step 1

Research

Find what customers consciously and subconsciously need before designing tests.

DRIP's research combined reviews, behavior data, psychological drivers, buying motivations and category entry points into one picture of the buyer. SNOCKS shoppers were practical, comfort-led, skeptical of hype, and highly responsive to proof when proof removed daily friction.

The test roadmap stopped being a list of page ideas and became a behavioral model: prove comfort, reduce first-order risk, make fit easier, and remove hidden effort from high-intent paths.

SNOCKS heatmap showing interaction with product color swatches
Behavioral frictionHeatmaps showed shoppers repeatedly working through variant and product-choice uncertainty.
SNOCKS heatmap showing size selector interaction
Fit anxietySize-selector interaction revealed uncertainty before add-to-cart, not just preference selection.

Input

Customer language + behavior

Reviews, heatmaps, session recordings, search behavior, and documented analyses were treated as one evidence base.

Model

Buyer psychology

We mapped comfort, security, autonomy, fairness, and fit certainty into decision drivers.

Output

Testable hypotheses

Every insight translated into a page surface, proof mechanism, and measurable learning goal.

Step 2

Prediction & prioritization

Use each signal and result to make the next test more likely to win.

Ideas were not kept in a static backlog. They were scored by customer evidence, page type, expected impact, effort, confidence, and research signal, then re-ranked as new test results came in.

Prioritization was the bridge between research and revenue. The backlog forced scientific discipline: strongest signal, clearest hypothesis, highest impact, lowest wasted effort.

SNOCKS experiment backlog with scored and prioritized test ideas
Prioritization tableThe backlog translated research signals into scored experiments across page type, confidence, effort, and roadmap timing.
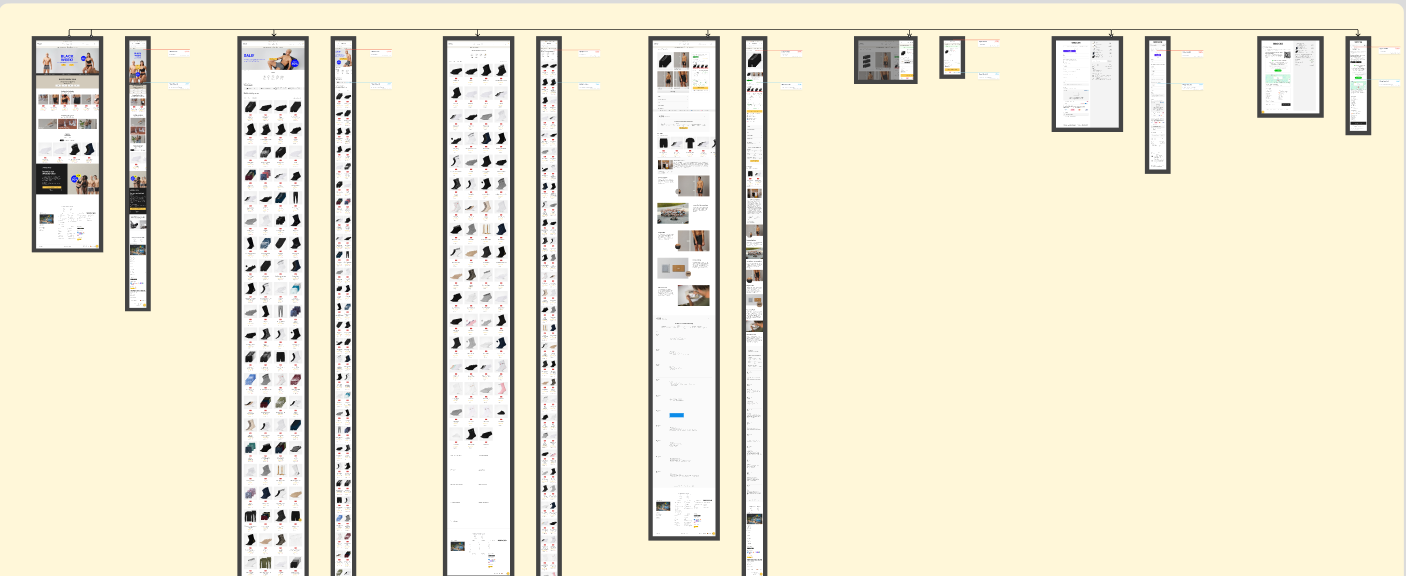
SNOCKS product page and collection page evolution map
Compounding roadmapThe system evolved across PDPs, PLPs, mobile paths, modules, and post-click buying flows.

Score

Evidence, impact, effort, confidence

Each idea had to earn its place through customer signal strength and expected business value.

Rank

Roadmap by learning value

Tests were grouped and sequenced so one result could de-risk the next wave.

Loop

Re-prioritize after every result

Winners became baselines, losers became constraints, and the next sprint got more precise.

Step 3

Parallel testing

Run more valid experiments in parallel instead of waiting for one test at a time.

Once the research was clear, hypotheses were split across PDPs, PLPs, cart, navigation, and offer modules. SNOCKS had enough traffic and access for a parallel testing system, so learning velocity became a growth lever.

The goal was not to find one miracle winner. It was to create enough high-quality shots on goal that the business could compound small wins while learning from every loss.

Current 2026 SNOCKS product detail page
PDP systemThe product page became a tested buying system: bundle logic, proof, fit support, and merchandising.
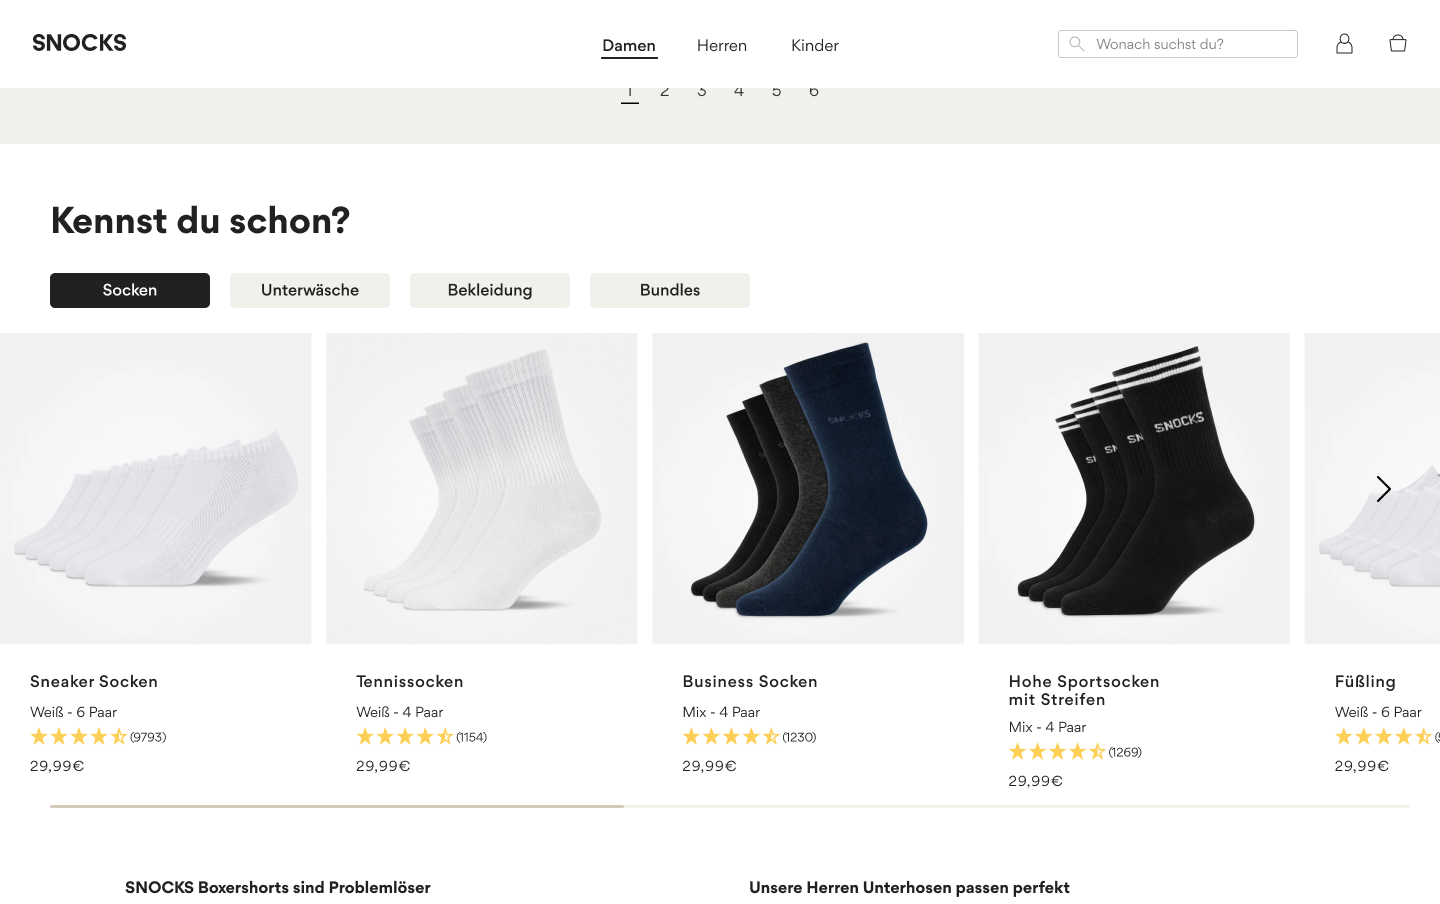
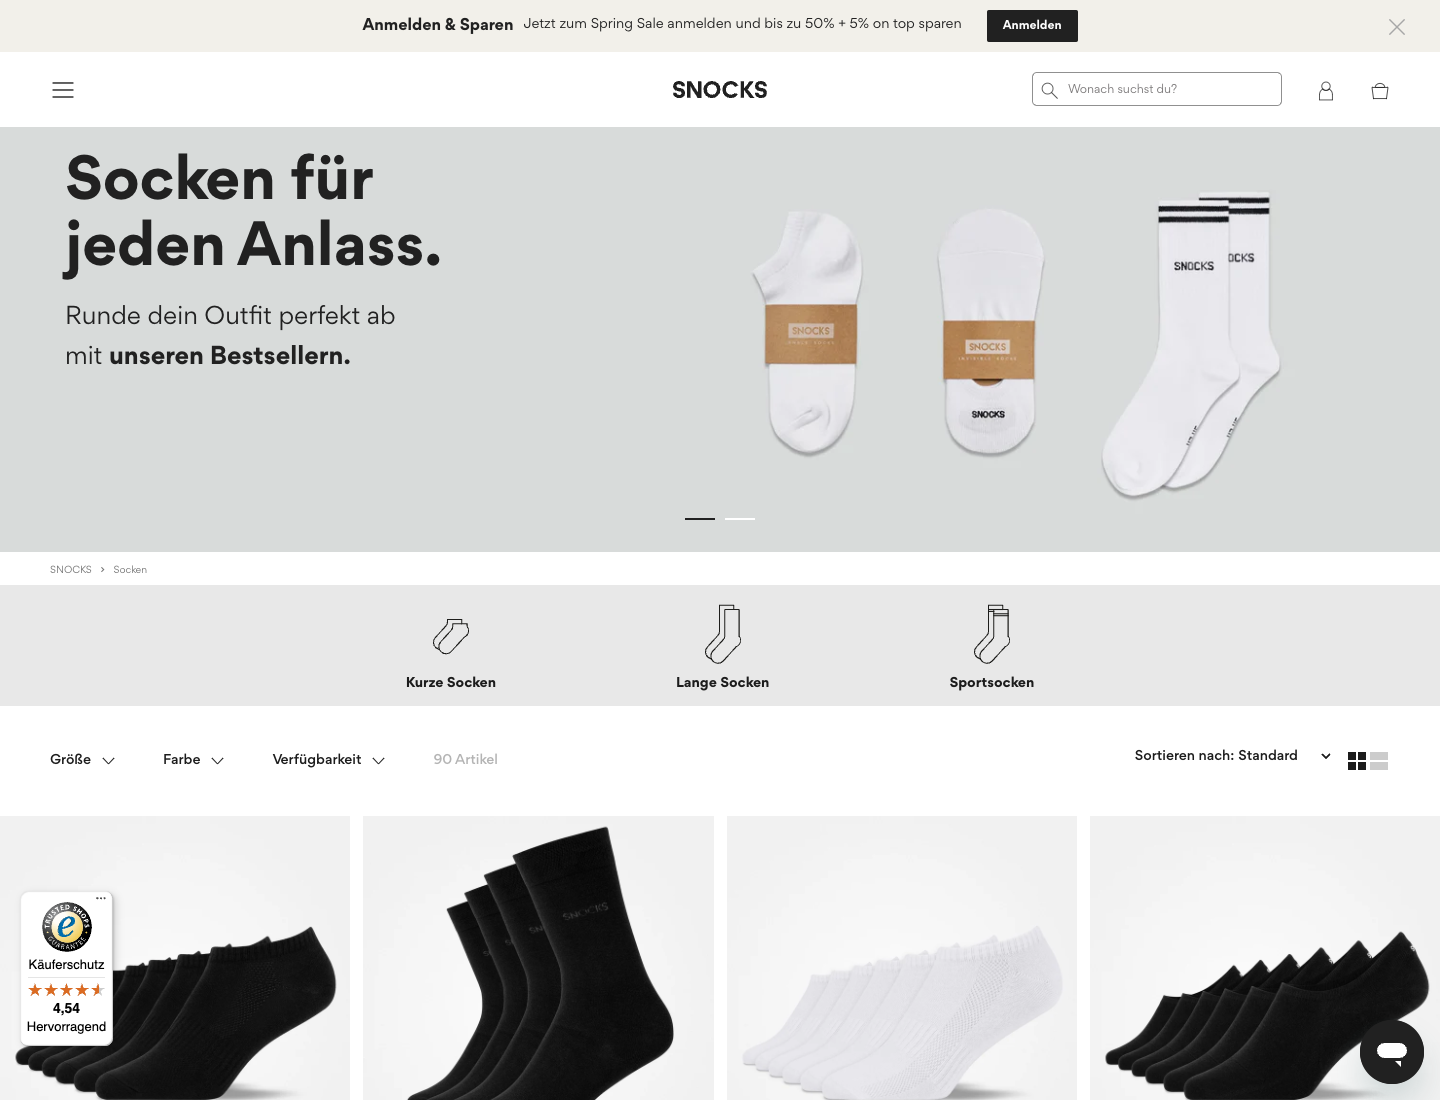
Current 2026 SNOCKS socks collection page
Collection systemTesting expanded into category-entry points, filters, product density, and collection-page merchandising.

Surfaces

PDP, PLP, cart, search, bundles

Research-backed ideas were split across the places where purchase confidence or product discovery broke down.

Cadence

6-10 experiments in parallel

The team moved from slow sequential testing to a portfolio of controlled experiments running at once.

Learning

Winner and loser extraction

Every test produced rollout decisions and a sharper understanding of what the buyer needed next.

What the research found

The strongest opportunity was not a new visual style. It was a sharper model of what shoppers needed to believe before buying: comfort as the pull, durability and sizing as the trust risks, and fairness as the conversion guardrail.

#Purchase driverDriver scoreMentionsSentimentpositiveneutralnegative
1

Comfort & Tragekomfort (no pressure points, no slipping)

Core functionality

Day-long comfort, soft feel, no pinching, no rolling, and a second-skin fit were the strongest repeat-purchase signals.

Driver score92
Mentions780
Sentiment85% positive10% neutral5% negative
2

Durability, holes & seams

Product quality

Reports of holes, seam failures, and fabric thinning made durability the largest trust-risk topic despite strong comfort sentiment.

Driver score90
Mentions650
Sentiment10% positive15% neutral75% negative
3

Fit and size consistency

User experience

Small sizing, color or batch variability, thigh fit, and shrinkage made first-time trial feel riskier than a basics purchase should.

Driver score82
Mentions430
Sentiment30% positive10% neutral60% negative
4

Anti-hole guarantee credibility

Trust

The guarantee accelerated first purchase, but the 6-month window could also trigger skepticism when failures happened later.

Driver score78
Mentions320
Sentiment45% positive20% neutral35% negative
5

Returns cost and transparency

Economic

When sizing felt uncertain, paid returns became a much larger source of perceived unfairness and purchase anxiety.

Driver score70
Mentions260
Sentiment10% positive20% neutral70% negative

What it meant for the roadmap

  1. 1

    Comfort was the strongest reason to buy

    Shoppers were not looking for exciting basics. They wanted underwear and socks they could stop thinking about.

  2. 2

    Search showed intent but was rarely used

    Visitors knew what they wanted, but the way to say it was hard to find.

  3. 3

    Fit certainty held the biggest upside

    People liked the product promise. The hesitation sat around the risk of a first order.

  4. 4

    Comfort, security and autonomy shaped the decision

    The promise only worked when sizing, guarantees and returns also felt predictable.

SNOCKS 2026 product detail page
Current 2026 PDPThe live 2026 product page architecture: bundles, thumbnail-based variant selection, trust, sizing support, and clear quantity economics.

What the actual tests looked like

The real control, variant and result screenshots behind each test.

Test 1 of 5

Search Visibility Optimization

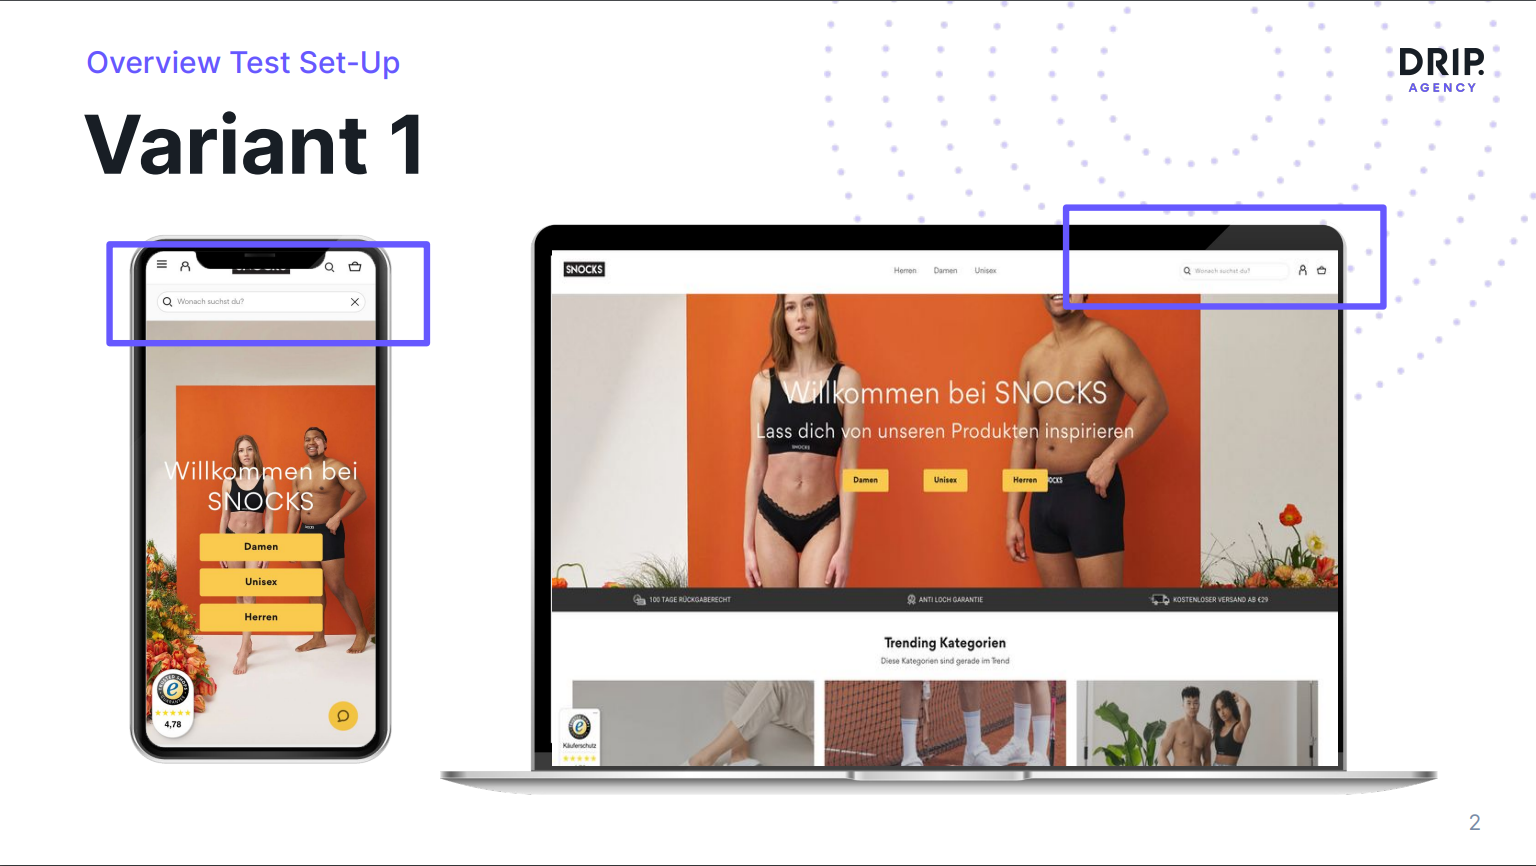
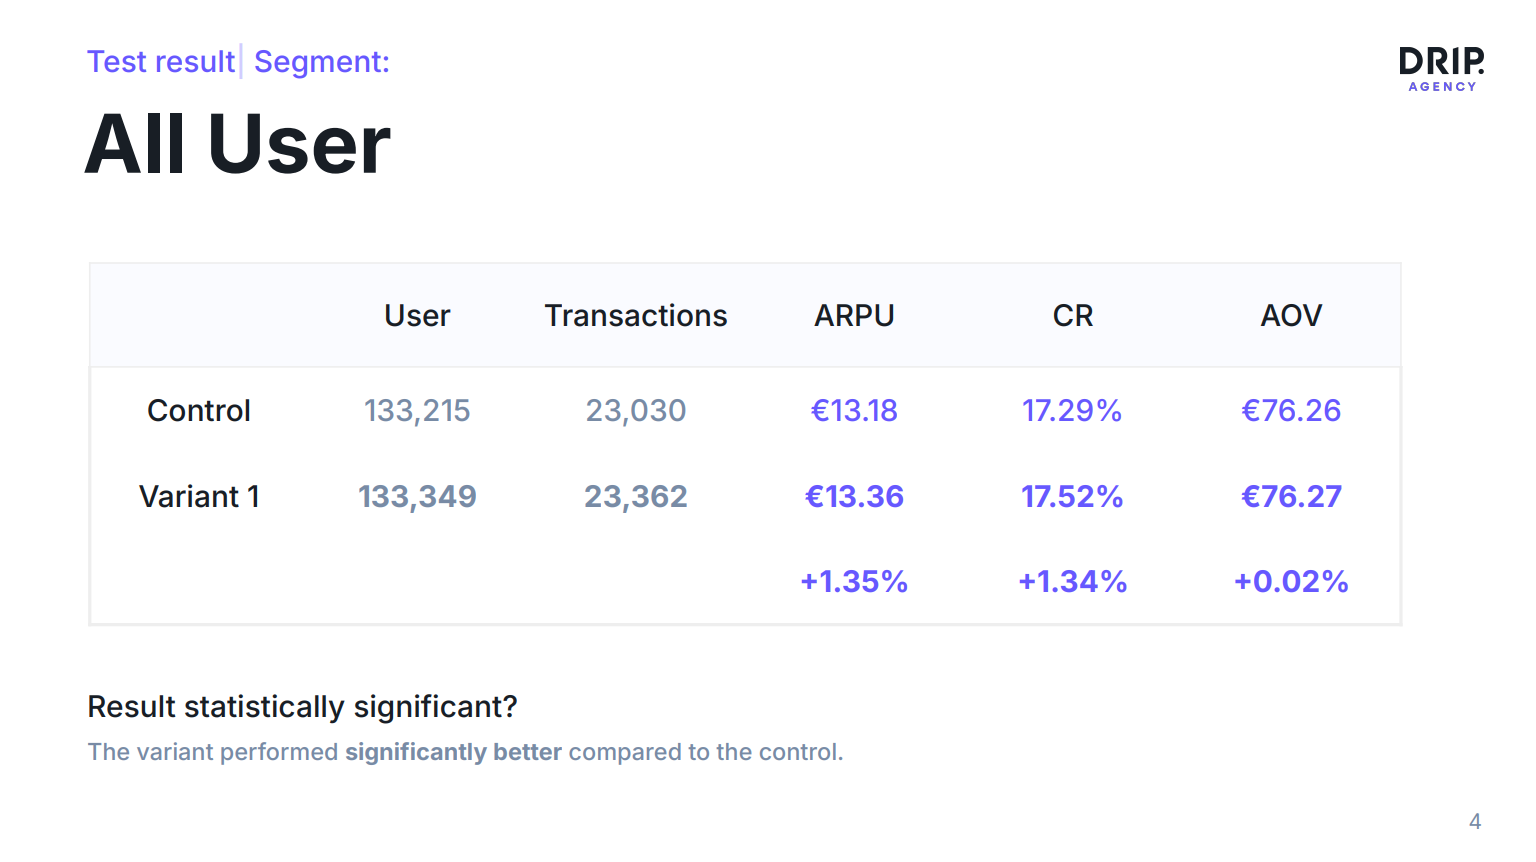
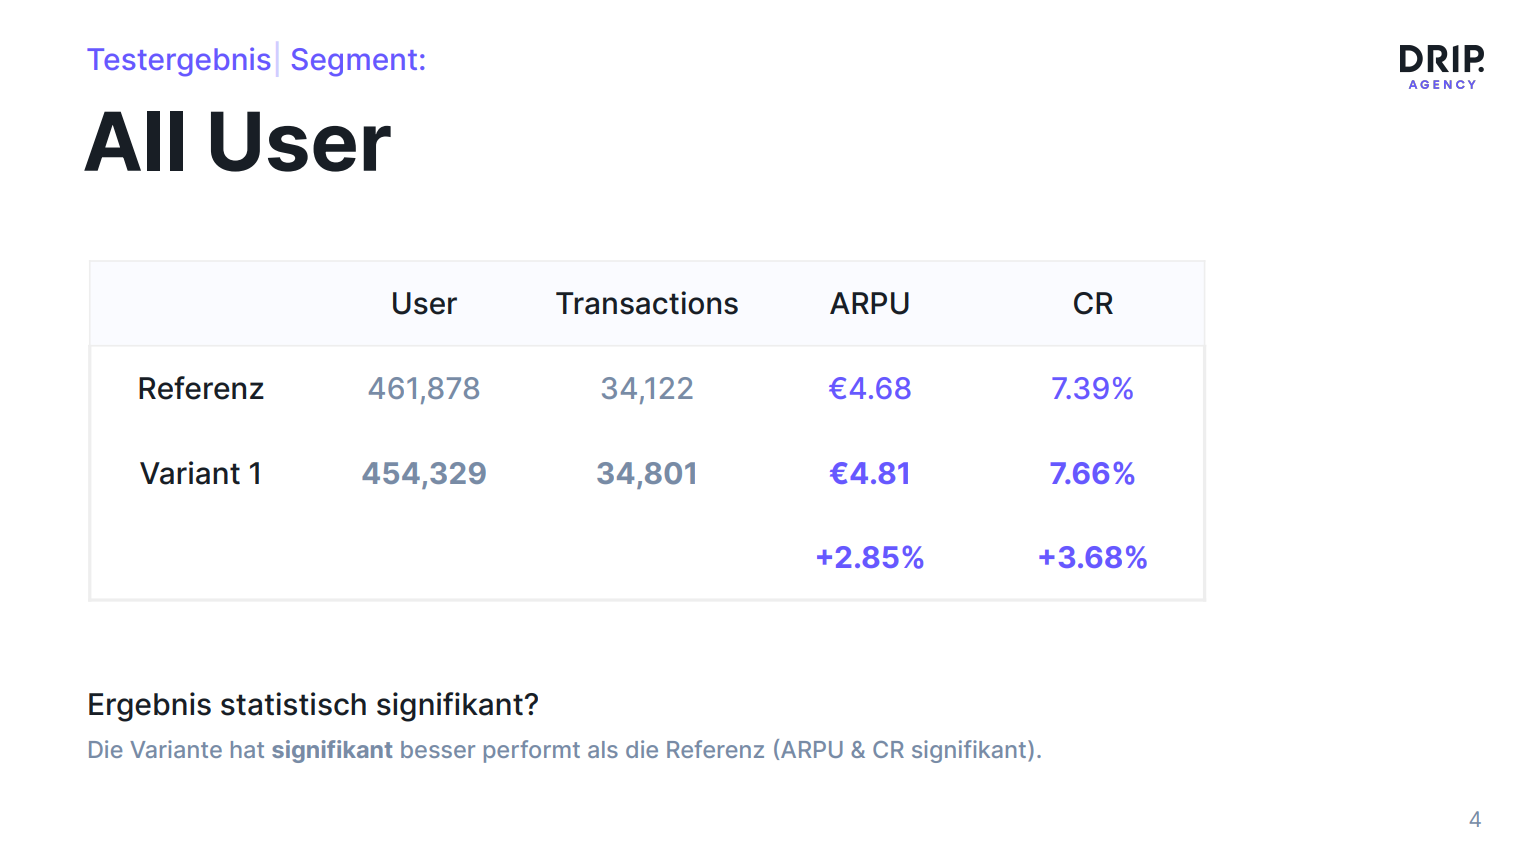
Users who used site search had a 19.24% conversion rate vs 6.87% for non-searchers. But only 0.08% of users actually used search (1,653 of 2.1M visitors), because it was barely visible. Using the BJ Fogg Behavior Model, we identified that ability (finding the search) and trigger (prompting the action) were both broken. We made search prominent and accessible.

CR 17.29% → 17.52%
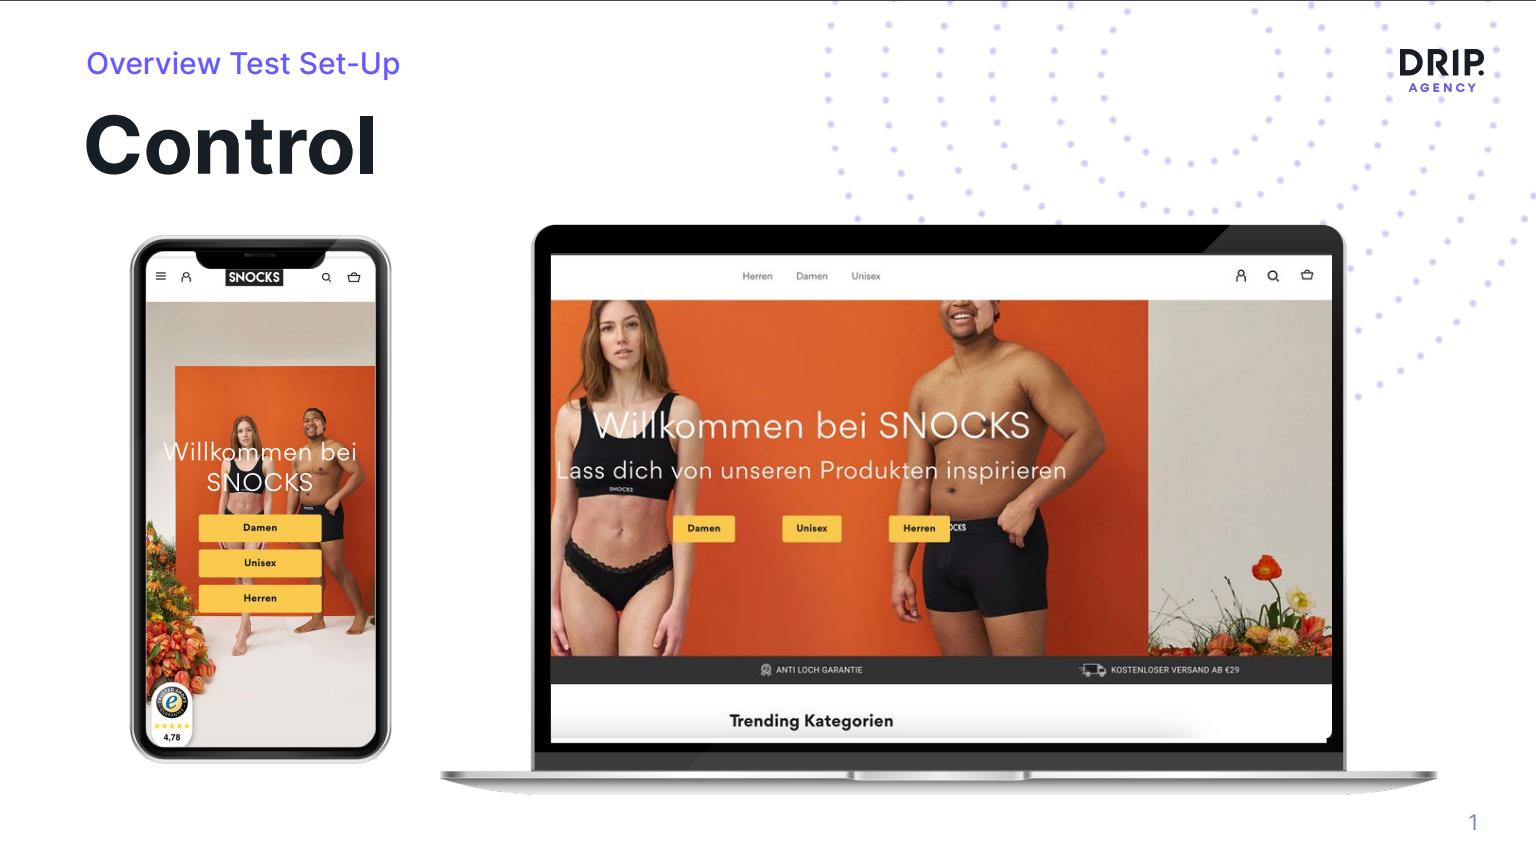
Search visibility control for SNOCKS homepage
Control
Search visibility variant with prominent search field
Variant
SNOCKS search visibility A/B test result screenshot
Result

Test 2 of 5

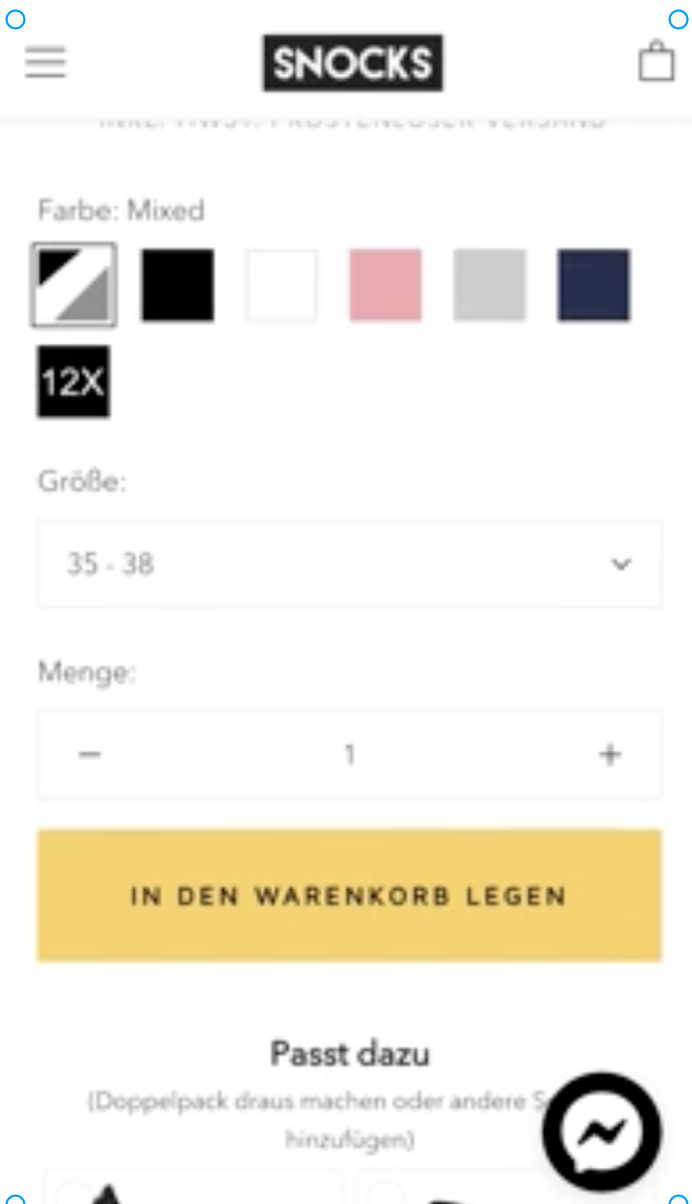
Color Swatches → Real Image Thumbnails

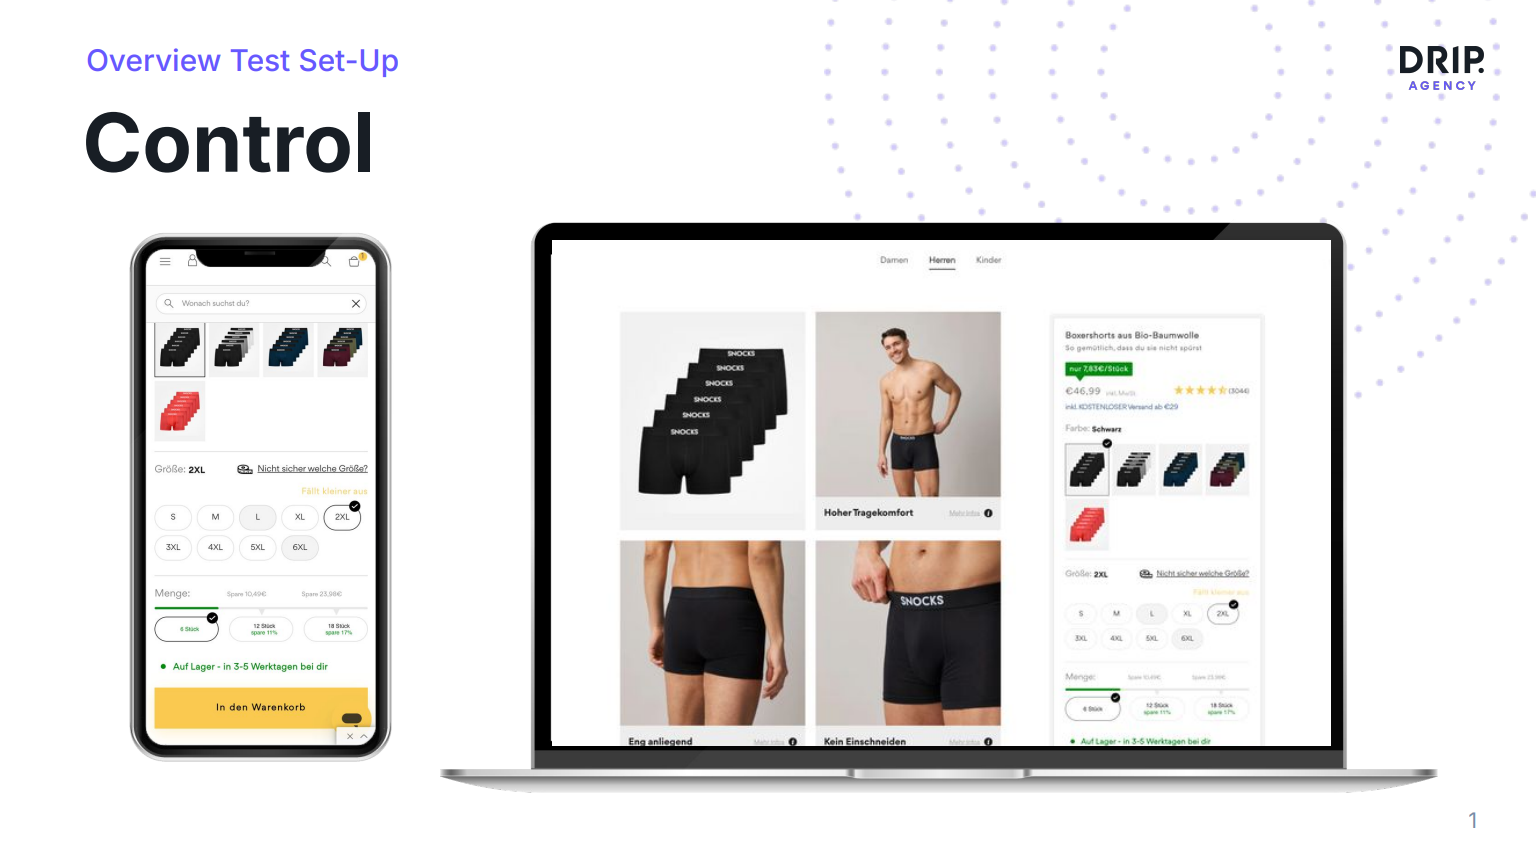
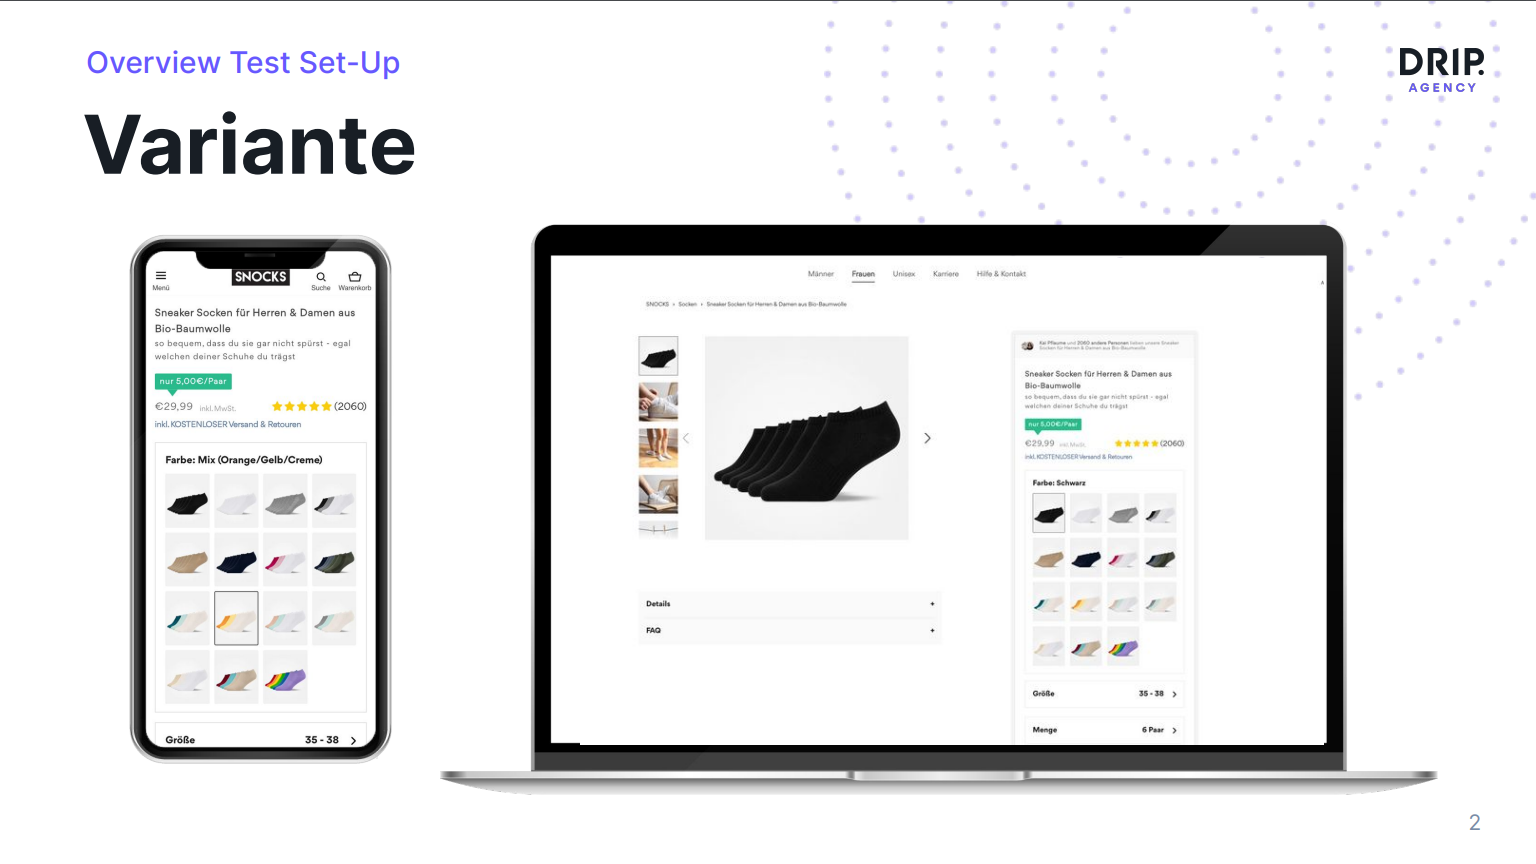
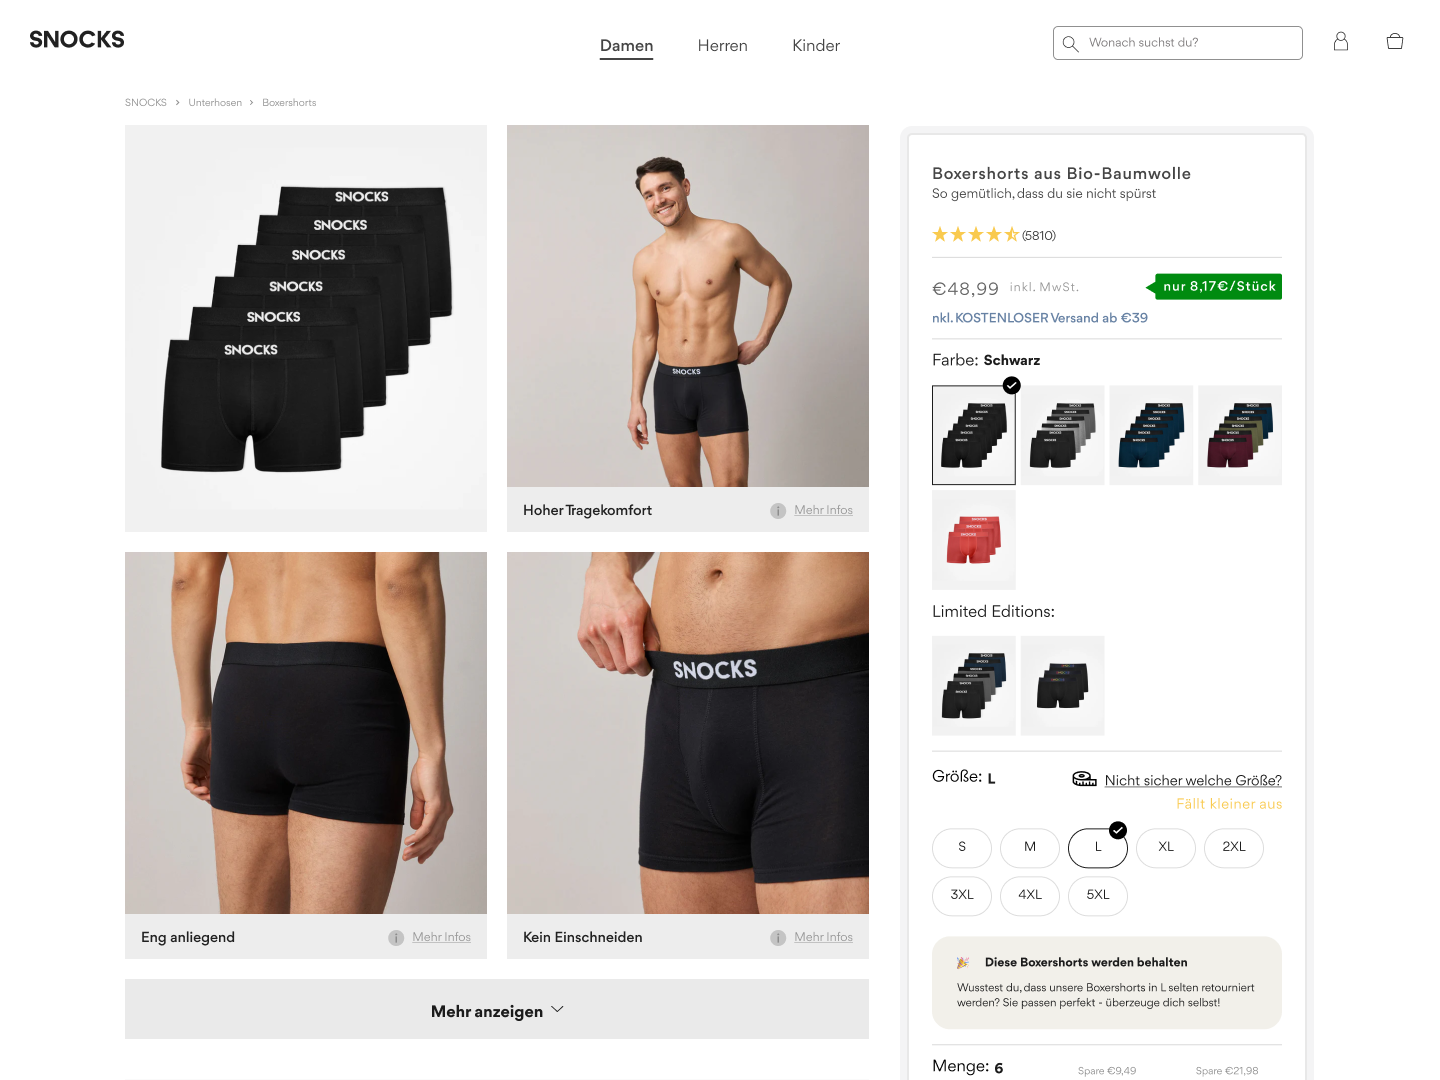
Product color selection used abstract color dots that required cognitive effort to differentiate. We replaced them with real product image thumbnails, reducing the cognitive load for comparing options. Customers could instantly see what each color variant looked like on the actual product.

SNOCKS product page control using abstract color swatches
Control
SNOCKS product page variant using product thumbnails as color selectors
Variant
SNOCKS color thumbnail A/B test result screenshot
Result

Test 3 of 5

Material Close-Up in Product Gallery

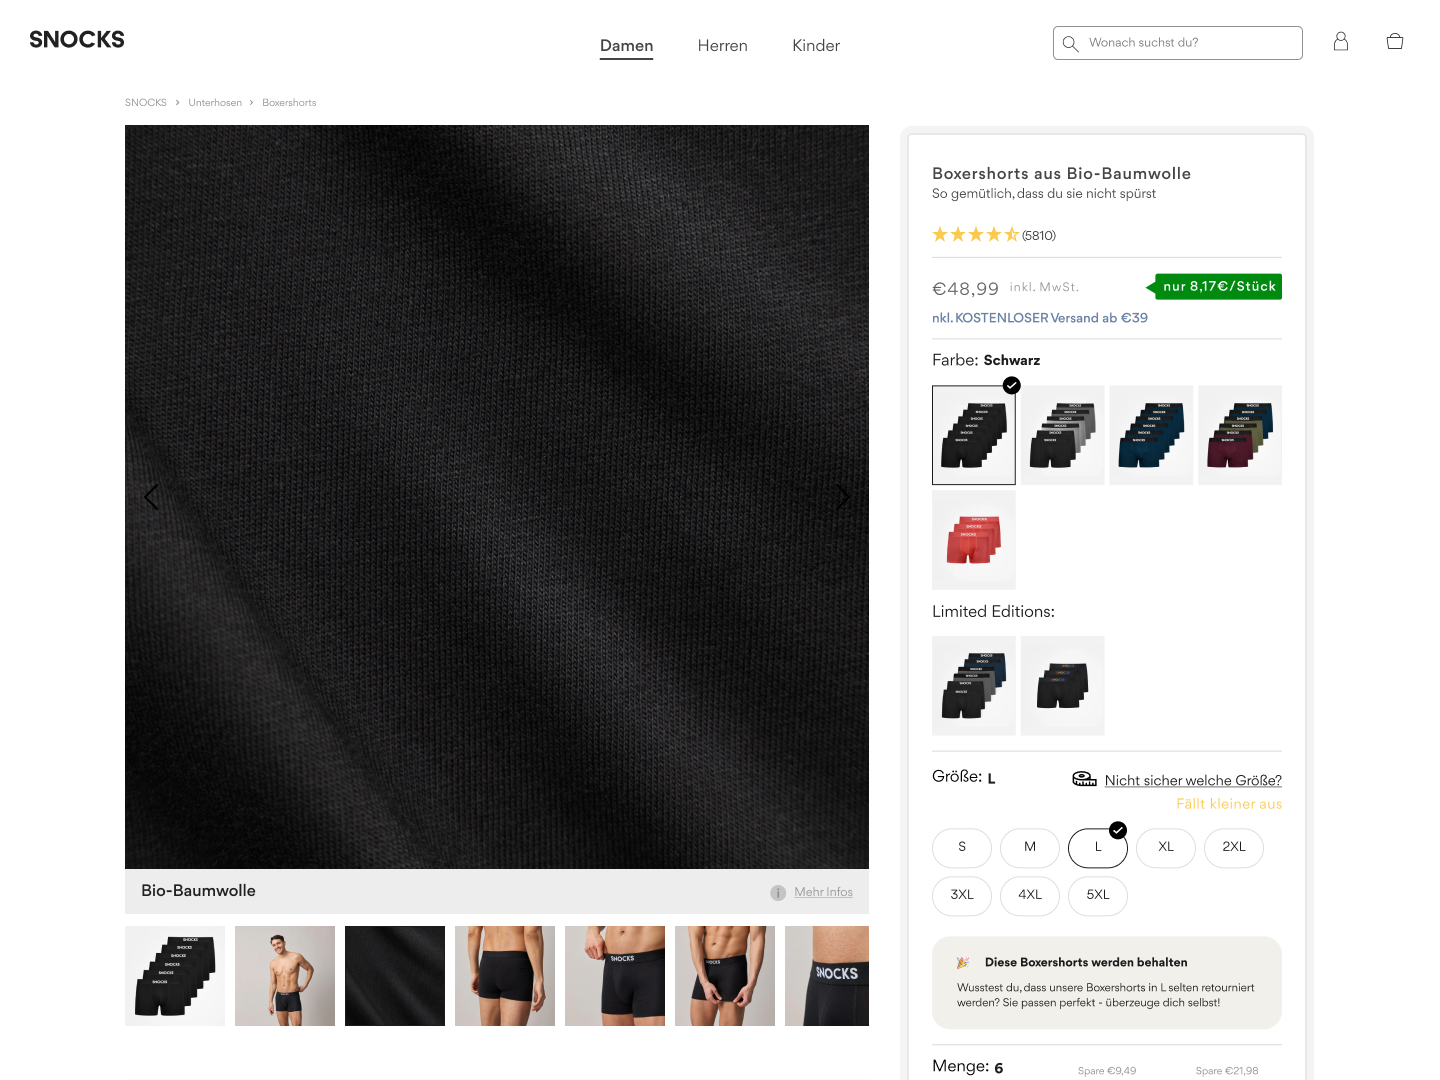
A recent PDP test: the variant added a tactile fabric close-up into the product gallery. It reduced uncertainty around material quality and gave shoppers a more concrete reason to trust the basics product before choosing a bundle.

Revenue €1.00M → €1.04M+€39K during test runtime
SNOCKS material gallery control screenshot
Control
SNOCKS material close-up product gallery variant screenshot
Variant

Test 4 of 5

Cart Cross-Sell Optimization

Tested different approaches to cross-sell recommendations on PDPs and in the cart, focusing on relevance and timing of the recommendation. The strongest variants aligned suggestions with the psychological driver of completeness: completing a set rather than adding random products.

Revenue €167K → €176K+€8.4K during test runtime
SNOCKS cross-sell control screenshot
Control
SNOCKS cross-sell variant screenshot
Variant
SNOCKS cross-sell test result screenshot
Result

Test 5 of 5

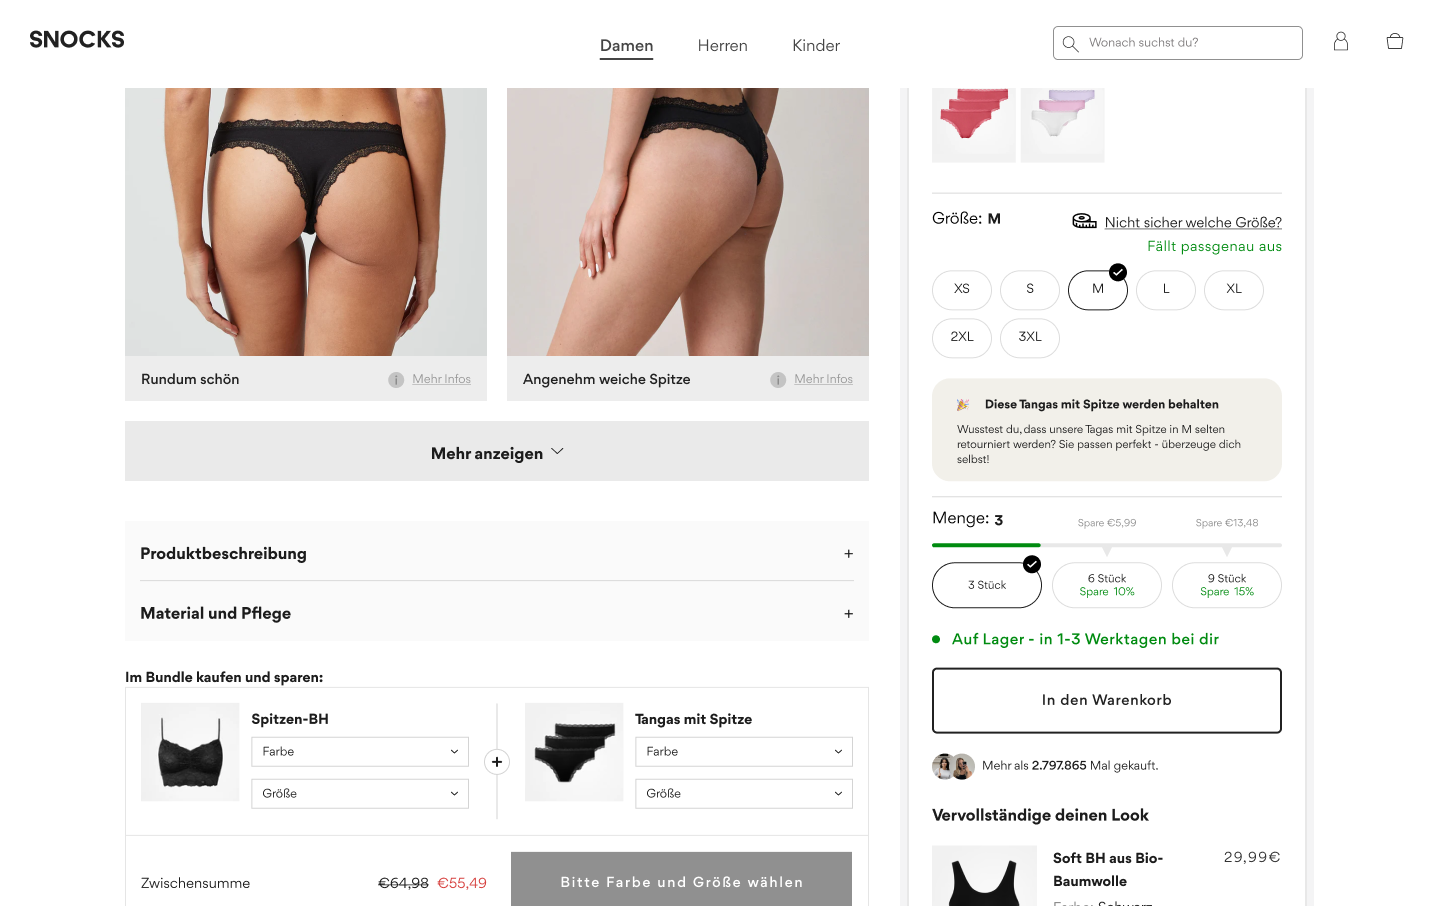
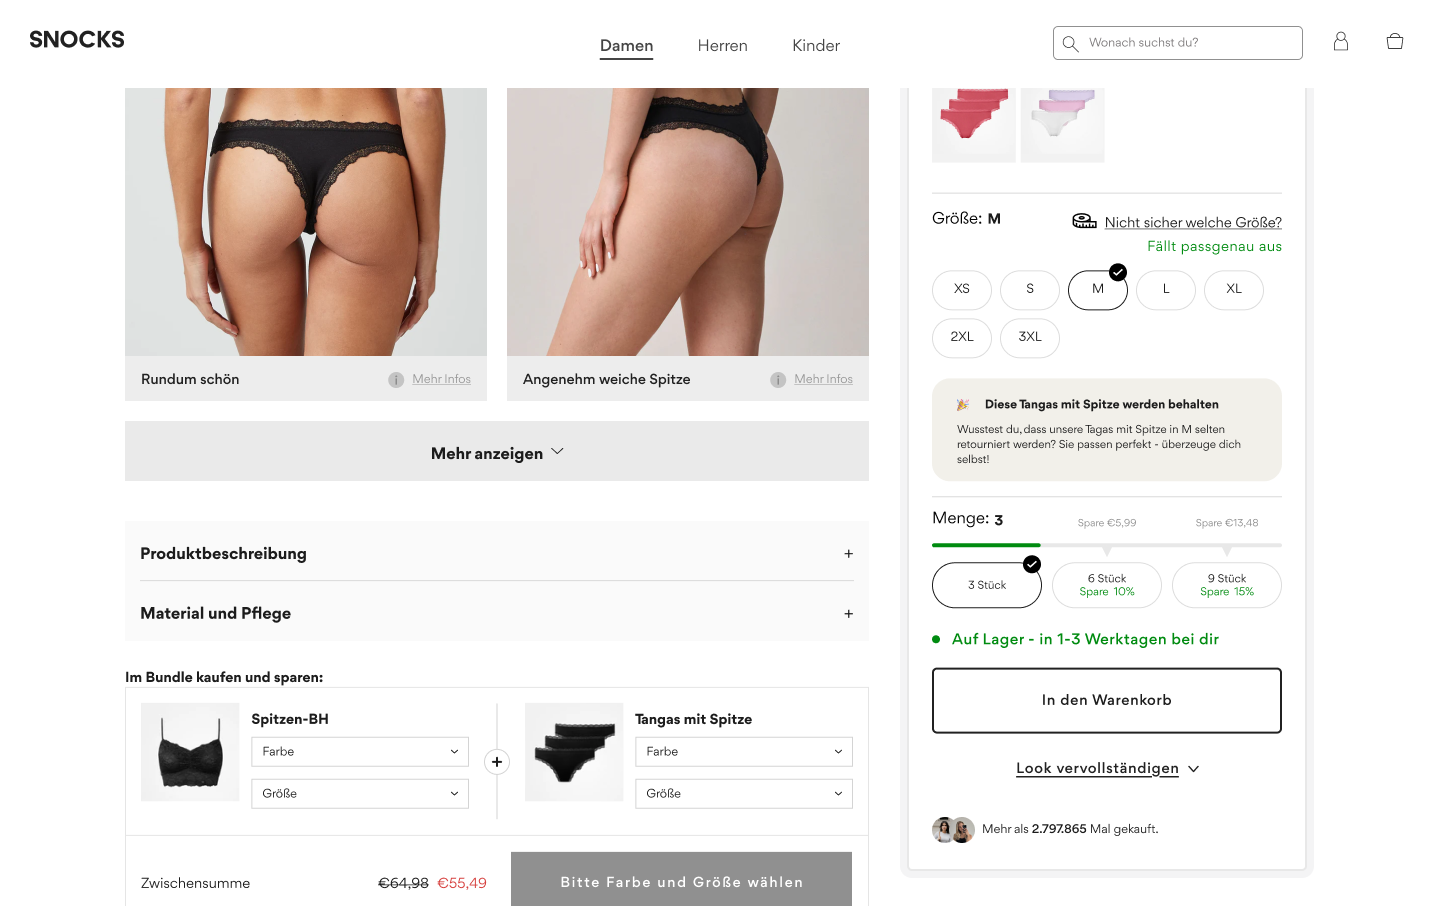
Secondary “Complete the Look” CTA

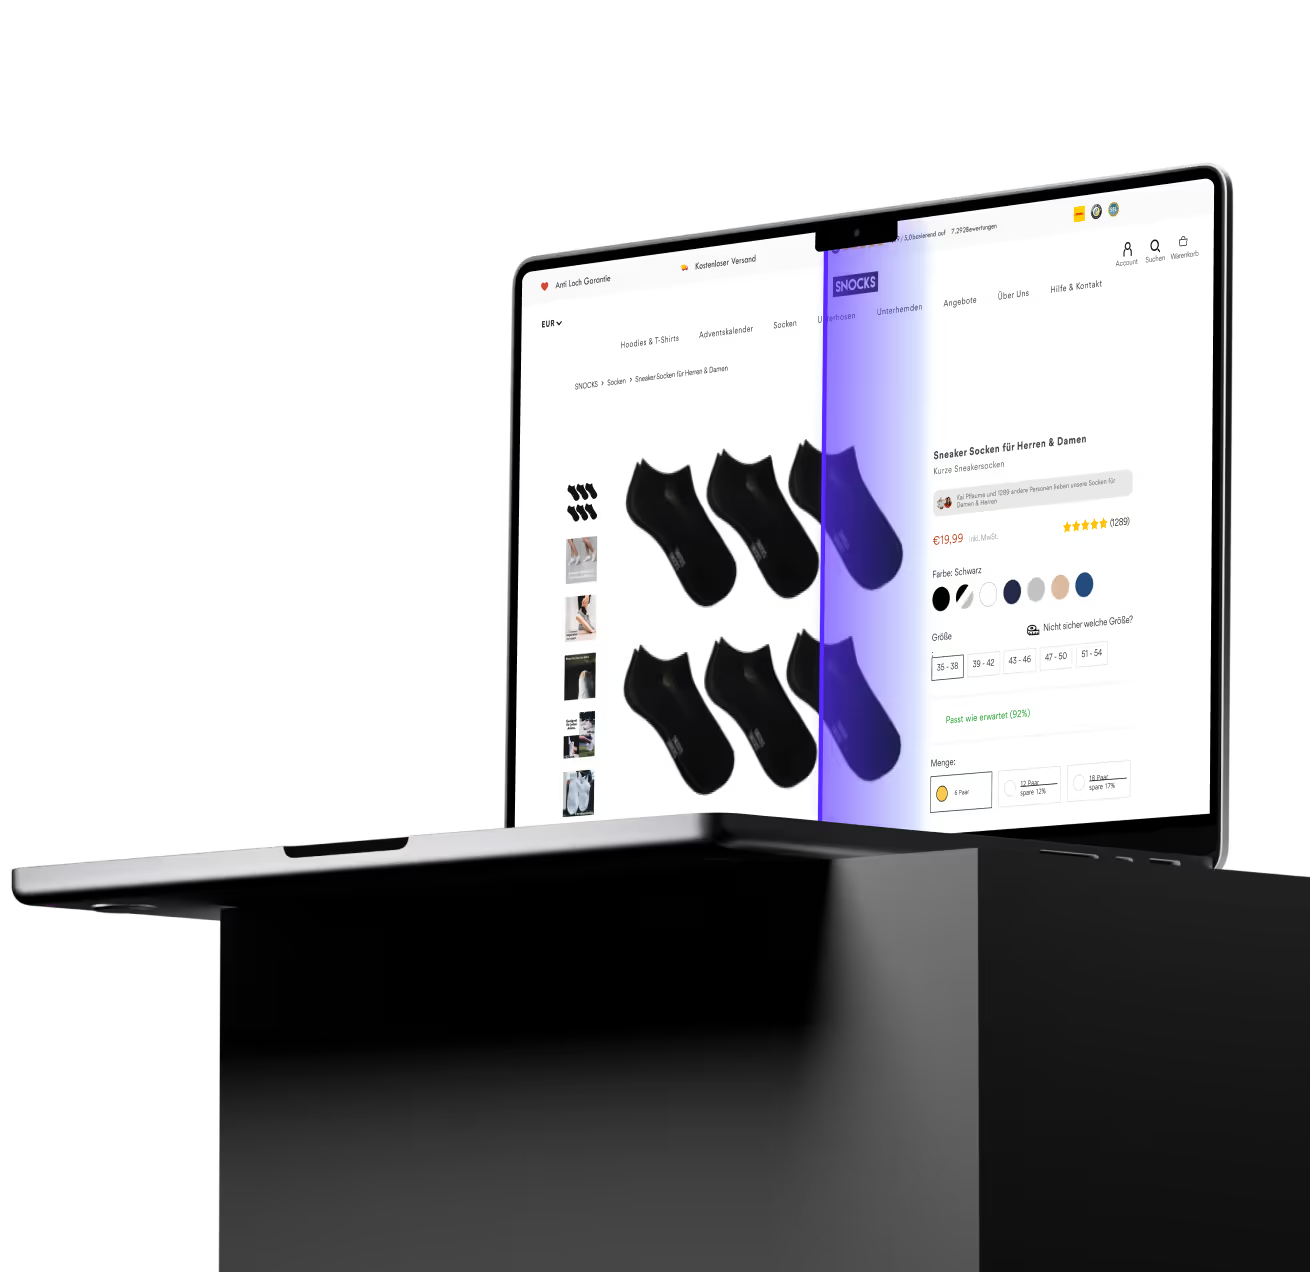
A documented winner on unisex PDPs: adding a secondary 'Complete the look' CTA below Add to Cart gave shoppers a low-friction path into complementary products without competing with the primary purchase action.

Revenue €70K → €75K+€5.1K during test runtime
SNOCKS PDP control without secondary complete the look CTA
Control
SNOCKS PDP variant with secondary complete the look CTA
Variant
SNOCKS complete the look test result screenshot
Result

Overall impact

Over five years, the partnership generated €8.2M in additional revenue attributed directly to CRO efforts.

This is extremely unusual. SNOCKS saw it increase every single year. That's the compounding effect of systematic, psychology-driven testing at high velocity.

Average order value grew from €29 to €51, not through discounting or artificial bundling, but through genuinely understanding what customers valued and making it easier for them to buy more of what they wanted.

The partnership continues today, with DRIP remaining SNOCKS' conversion optimization partner since 2019.

The takeaway

The SNOCKS case demonstrates that CRO isn't about finding one silver bullet test. It's about building a system that compounds learning over time. With 350+ experiments, the vast majority of individual tests had modest impacts. But layered together, they created a fundamentally different business.

The critical insight: volume matters more than any individual test's impact. Running 100+ experiments per year, grounded in real consumer psychology, not guesswork, creates a compounding advantage that competitors running 12 tests a year simply can't match.

For brands in the €2M-€10M range looking to scale: your bottleneck probably isn't traffic or product. It's how much revenue you extract from each visitor. Fix that, and the acquisition math works at every scale.

They supported us every step of the way, from underdogs to market leaders. Their expertise helped us stay profitable, giving us the foundation to scale and dominate our market.

Johannes Kliesch

Founder, SNOCKS

DRIP and Apex

Spend the same on ads.
Make more from them.

Book a call with the team and tell us about your shop. We'll talk through where it stands, where you want it to go, and how we'd get you there. If working with us isn't the best return on your money, we'd tell you rather than take it.

See if your shop is a fit

30 minutes, and you'll know exactly where your shop stands.

More case studies

KoRo

€2.56M in 6 months

How KoRo added €2.56M in 6 months by turning first-time A/B testing into a research engine

Read case study →
Kickz

3.6× conversion rate

How Kickz went from 0.59% to 2.7% conversion rate in 3 years

Read case study →
Giesswein

€12.2M over 3 years

How Giesswein added €12.2M in revenue after a post-COVID drop

Read case study →

The Newsletter Read by Employees from Brands like

LEGONikeTeslalululemonPelotonSamsungBoseIKEA

Join 17,000+ Ecom founders turning CRO insights into revenue

Trusted by 250+ brands

  • Strauss
  • Koro
  • Sunday Natural
  • The Body Shop
  • Grover
  • Hello Fresh
  • Natural Elements
  • AG1
  • Bluebrixx
  • Woom
  • Hornbach
  • Tourlane
  • Congstar
  • Holy
  • Junglück
  • PV
  • Wunschgutschein
  • Motel A Mino
  • Ryzon
  • Kickz
  • The Female Company
  • Livefresh
  • Schiesser
  • Horizn Studios
  • Seeberger
  • Luca Faloni
  • Zahnheld
  • Snocks
  • Bruna
  • NatureHeart
  • Priwatt
  • Jumbo
  • NKM
  • Oceansapart
  • Omhu
  • Blackroll
  • 1 Kom Ma 5
  • Purelei
  • Giesswein
  • T1tan
  • Buah
  • Ironmaxx
  • Waterdrop
  • Send a Friend
  • Fitjeans
  • Mofakult
  • Plantura
  • BGA
  • Coop
DRIP / Apex

Prediction-based experimentation for online shops from €100k a month.

See if your shop is a fit

Company

  • About us
  • Case studies
  • Process
  • Careers
  • Experts
  • Media
  • Reviews

Services

  • Done for you
  • Done with you
  • CRO agency
  • A/B testing agency
  • Shopify CRO

Apex

  • Apex
  • How we built the genome
  • Log in
  • Docs

Resources

  • Blog
  • Resources
  • Research
  • Benchmarks
  • Statistics tools
  • Best A/B testing tools
© 2026 Drip Trading GmbH
ImprintPrivacyTerms

Cookies

We use optional analytics and marketing cookies to improve performance and measure campaigns. Privacy Policy