01What Percentage of A/B Tests Win?
Across the industry, about 1 in 5 A/B tests wins. More than 50% of our A/B tests win because DRIP pre-qualifies every hypothesis with quantitative analytics, session recordings, and heatmap data before building a test. Teams that test ideas without data backing will see lower win rates. The takeaway is not that our number is better, but that research-driven hypothesis generation measurably improves outcomes.
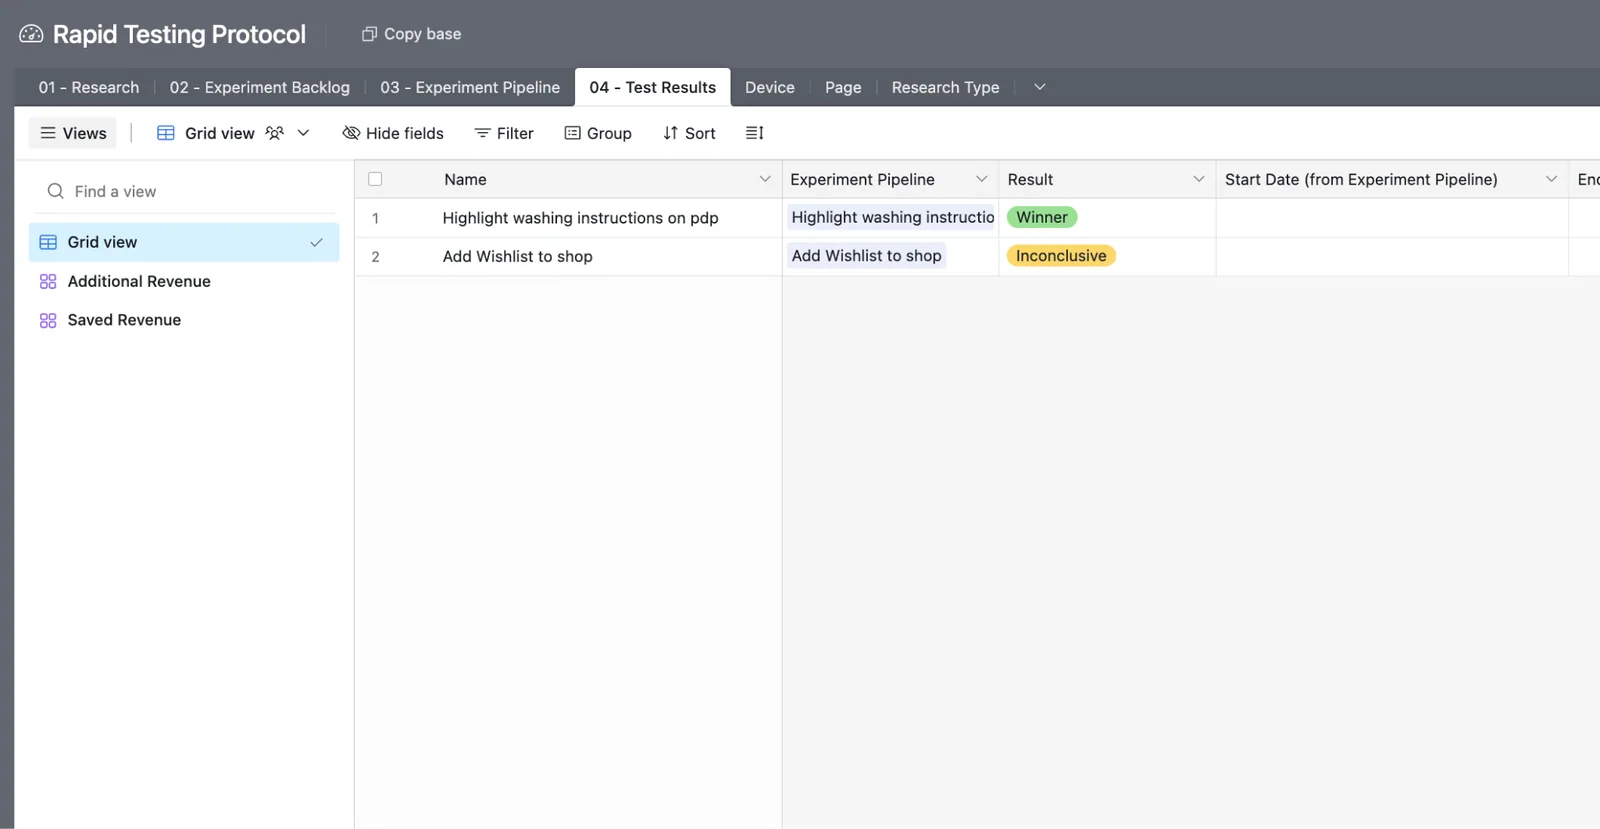
Count your win rate honestly: every launched test goes into the denominator, including the inconclusive ones. A win rate that only counts tests with a clear result looks better than it is and hides how much traffic went into tests that decided nothing.
02How Much Revenue Uplift Do Winning A/B Tests Generate?
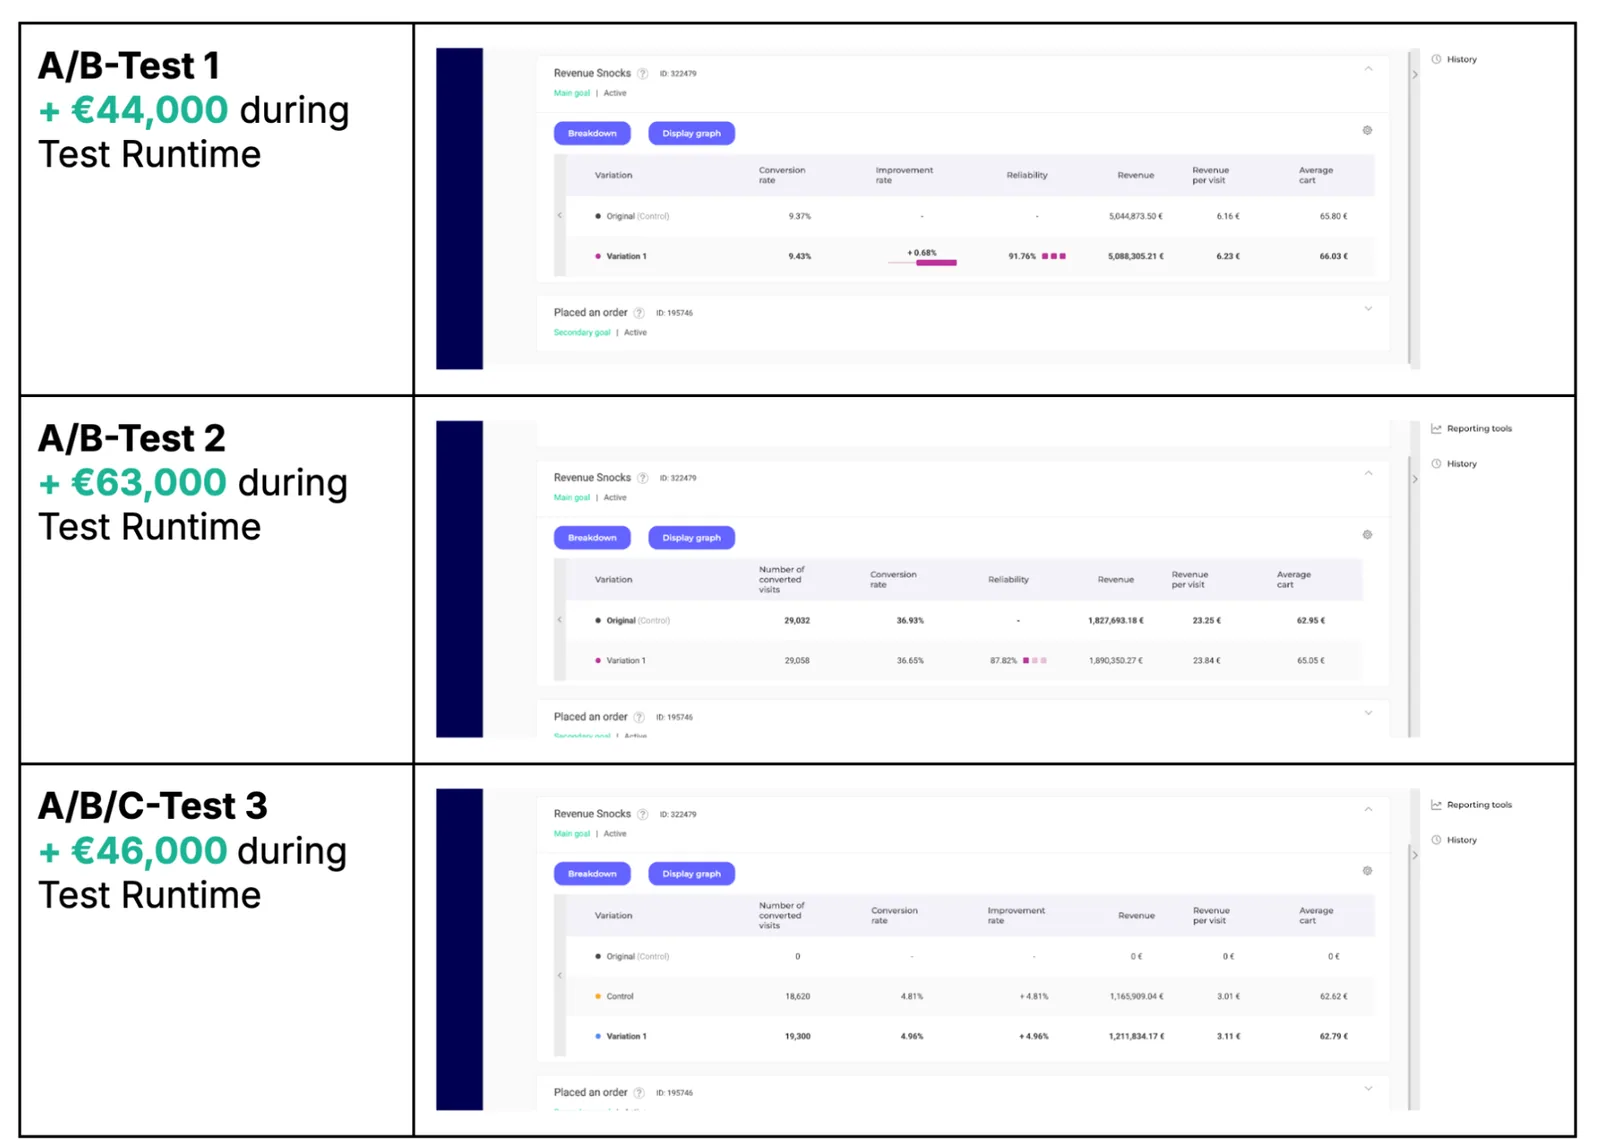
Not all wins are equal. A test that lifts revenue per visitor by less than one percent and one that lifts it by close to ten percent both count as wins, but their business impact differs by an order of magnitude. Understanding that spread is critical for forecasting the ROI of your testing program.
RPV (Revenue Per Visitor) is the more complete metric because it captures both conversion rate and average order value effects. A test can win on RPV while remaining flat or even negative on conversion rate. This happens when a variant increases AOV more than it decreases CR, for example a bundle layout that converts slightly fewer visitors but at a significantly higher cart value.
The distribution of winning effects is right-skewed: most winners are modest, and a smaller number of high-impact winners pull the average up. This is why the number of good tests matters. The more well-researched tests you run, the more likely you are to find one of the outsized winners that disproportionately drive program ROI.
03Which Types of A/B Tests Tend to Win?
Not all experiment categories are created equal. Some test types address high-leverage psychological triggers or remove friction at critical decision points. Others attempt changes that conflict with established user expectations. An A/B testing agency can turn these patterns into a prioritized backlog instead of treating every category as equally promising.
- Tests that address purchase anxiety (shipping info, return policies, social proof) reduce perceived risk at the moment of decision.
- Visual enhancement tests (product images with USPs, material descriptions) add information without disrupting learned navigation patterns.
- Category averages are a starting point, not a verdict. The same change can win on one shop and lose on another, so the audience decides.
Test types that often disappoint
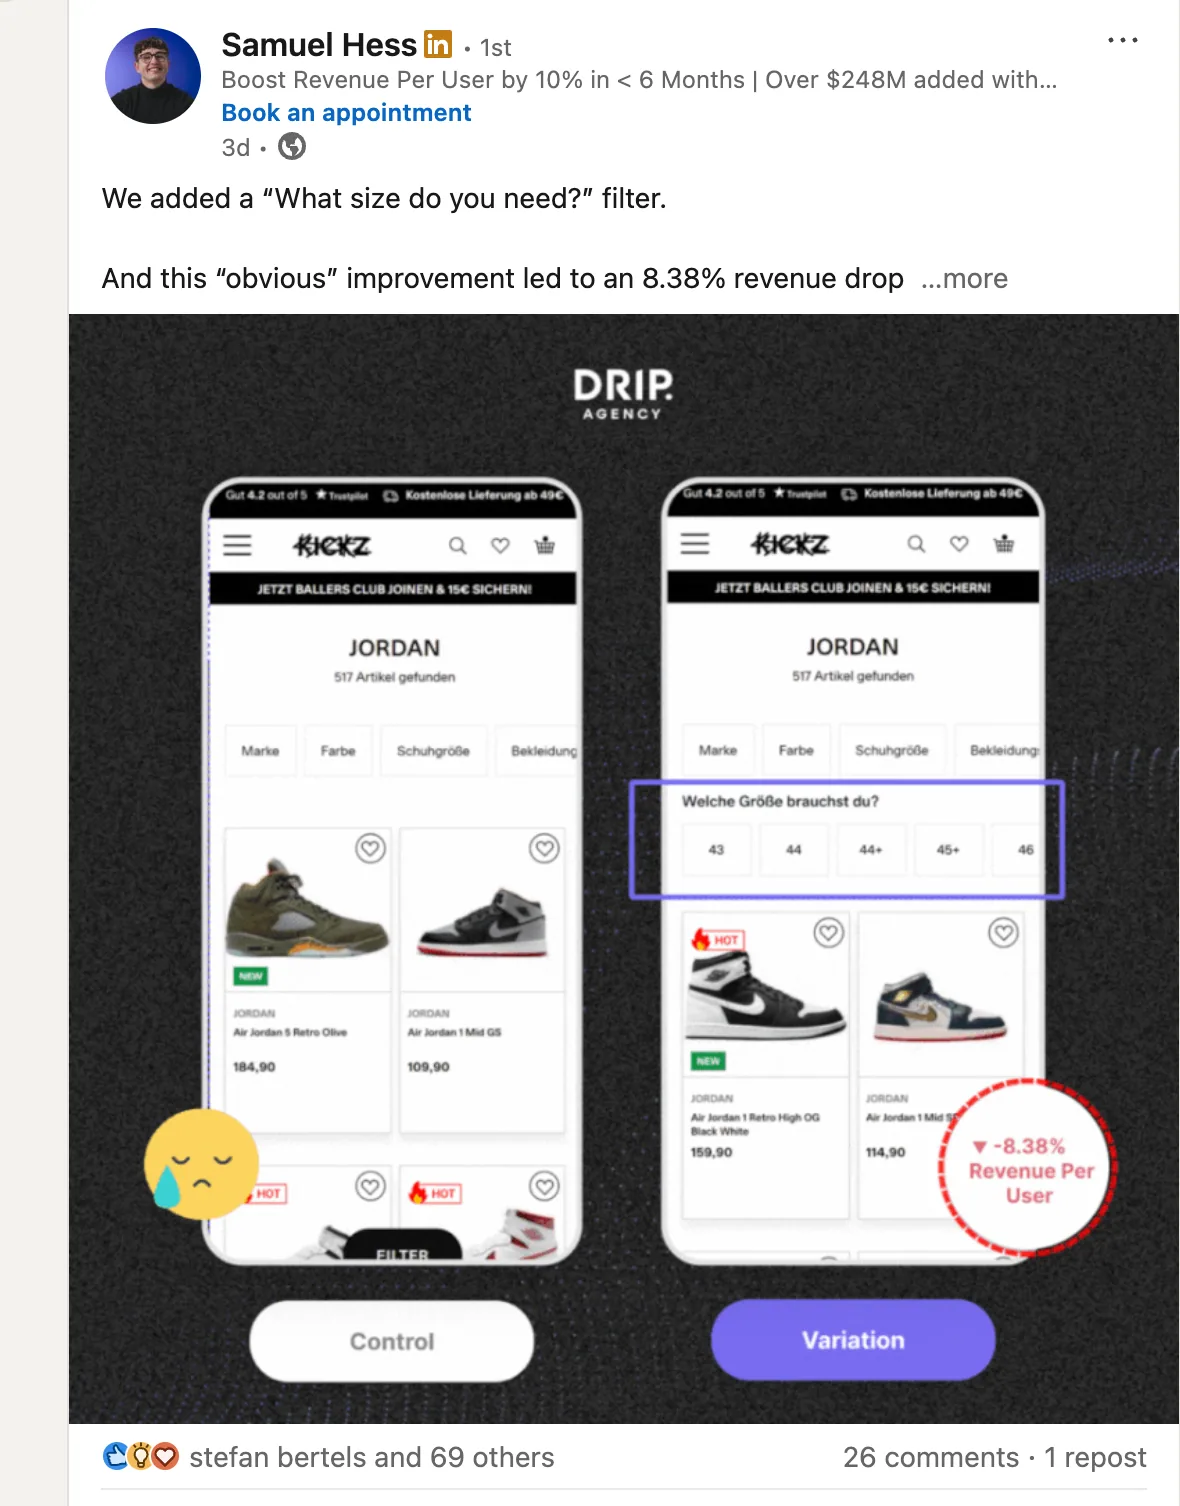
Custom inline form validation frequently breaks the native browser experience and introduces more friction than it removes. Quick checkout experiments can remove steps that users actually rely on for confidence. Exposed filters and recently viewed sections add navigation complexity to product listing pages, which rarely pays off.
04Where Should You Test First?
Where you test matters almost as much as what you test. Different page types sit at different points in the purchase funnel, and the further downstream you go, the higher the stakes of each interaction.
Product detail pages sit at the decision point where users evaluate whether to add a product to cart, and they carry a large share of a shop's traffic. That combination makes them the natural first testing surface for most e-commerce brands.
Navigation and landing page changes deserve extra caution. Users have strong expectations for discovery-phase UX, and changes that deviate from those expectations are as likely to hurt as to help.
05How Long Should You Run an A/B Test?
Test duration is one of the most frequently asked and most frequently misunderstood aspects of A/B testing. There is no universal answer because the right duration depends on traffic volume, baseline conversion rate, and the minimum detectable effect you are targeting.
Statistical significance requires sufficient sample size, which is a function of traffic volume and the size of the effect you are trying to detect. Small effects (under 2% relative improvement) require large samples and therefore longer runtimes. Larger effects can be detected faster. Because most e-commerce tests target modest improvements, they usually need multiple weeks of data collection.
Beyond sample size, test duration also needs to cover at least one full business cycle. E-commerce purchasing behavior varies by day of week, pay cycles, and promotional cadence. A test that runs only Monday through Friday may produce different results than one that includes weekends. Running in whole weeks keeps every weekday equally represented.
On the other end, tests that run for many weeks are typically low-traffic experiments waiting for statistical power. If a test is still undecided after 8+ weeks, reassess the setup: either accept a larger MDE, move to a higher-traffic surface, or continue only if the expected business value justifies the longer runtime.
06How Many Tests Should You Run Per Year?
Testing velocity is the engine of CRO compounding. Each test is a bet, and each winner builds on the ones before it. The more good bets you place per year, the more winners accumulate and compound.
The math is straightforward. At a stable win rate, the number of winners grows with the number of tests. Velocity only helps if quality holds: doubling the number of tests with weaker hypotheses mostly doubles the work spent on tests that will not win.
Larger brands with dedicated CRO teams or agencies (like DRIP) handling test development and analysis can sustain high-volume programs. Smaller brands with limited dev resources should focus on maximizing the impact of each test rather than chasing velocity for its own sake.
07How to Read A/B Testing Statistics
Published A/B testing statistics are hard to compare because they rarely define their terms the same way. Before you benchmark your program against any number, including ours, check how it was produced.
- How is a win defined? A significance threshold chosen in advance and a fixed sample size make a win meaningful. Stopping when a dashboard looks good does not.
- Are inconclusive tests counted? A win rate that leaves them out of the denominator is not comparable to one that includes them.
- Who ran the tests? A program with data-backed hypothesis generation will show a different win rate than one that tests untested best practices.
- Seasonal effects: tests running during Black Friday or holiday periods may show inflated or deflated effects relative to baseline periods.
For decision framing, we follow a fixed-horizon interpretation: predefine sample size, avoid peek-based stop rules, and evaluate significance at the end of the planned run. This is the same practical convention used in DRIP's public significance calculator and aligns with Georgi Georgiev's guidance on frequentist A/B test interpretation.