€70K in Split Results: Desktop vs. Mobile
We generated €70K/month but not one of the 15 tests was a clean winner across all devices. Each test won on mobile and lost on desktop, or the other way around. Here's what the data looks like in practice:
Free. Five quick questions, then it's yours.
What's inside
What you get
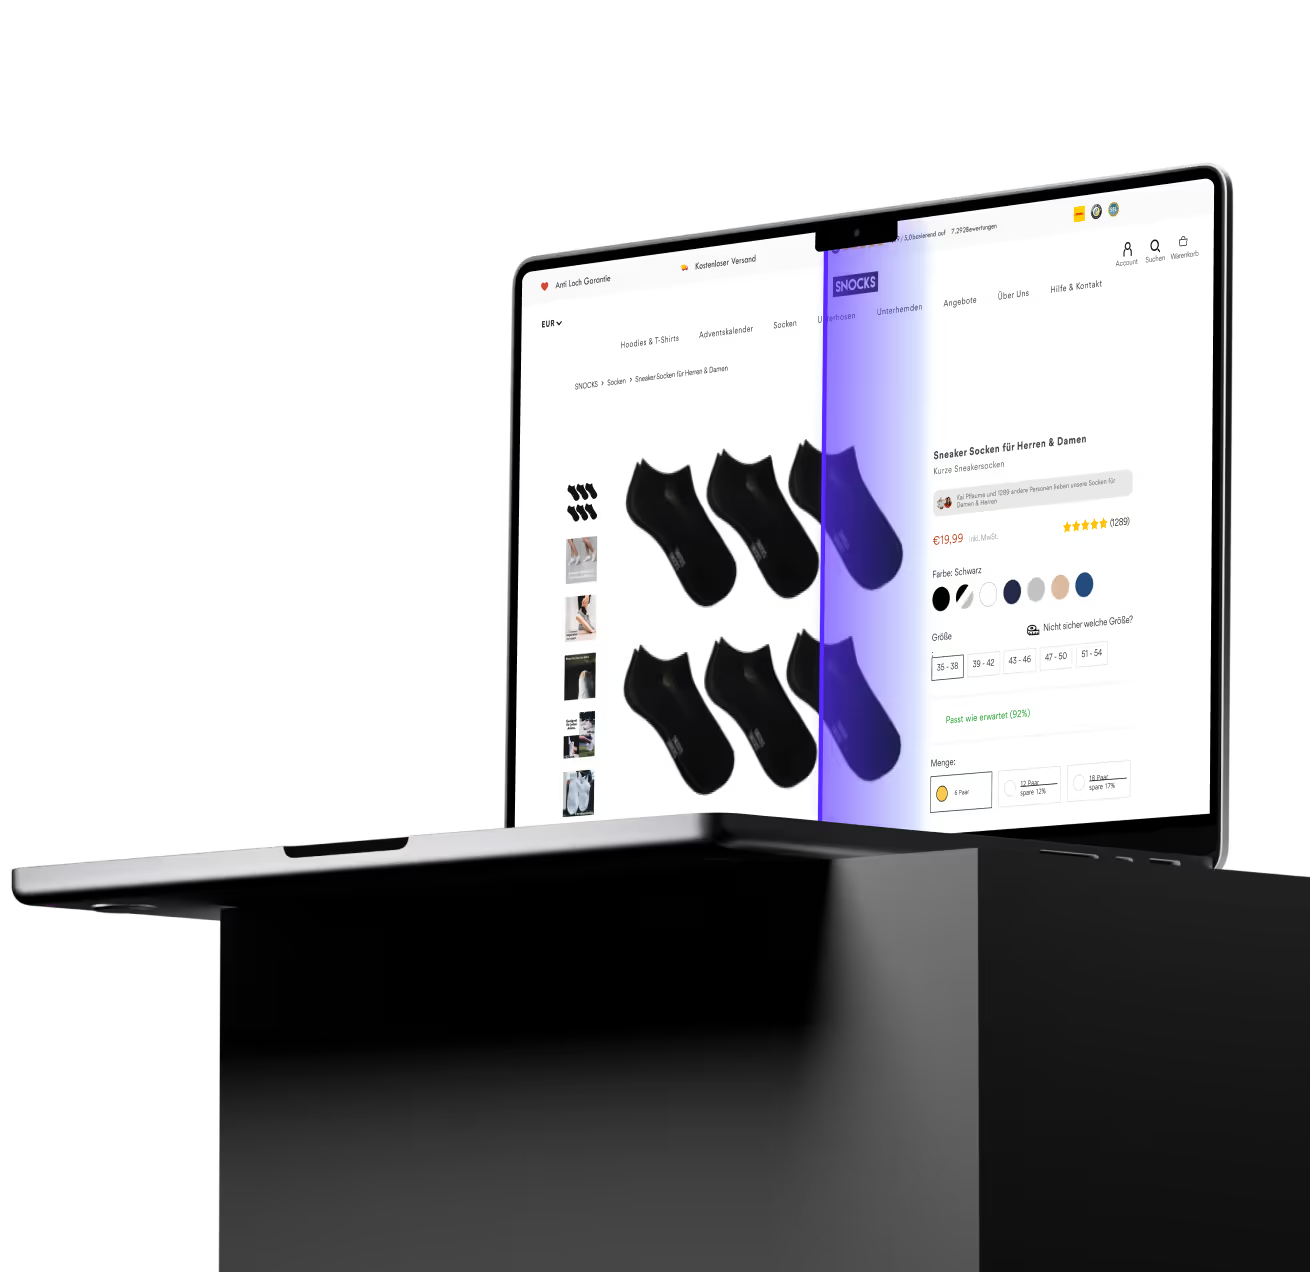
We tested replacing a static hero banner with a high-quality video on the homepage.
Overall CR: +0.15%. Looks flat, most teams would call it inconclusive and move on.
Split by device:
📱 Mobile: +2.52% CR · +2.41% ARPU
🖥 Desktop: -7.60% CR · -6.12% ARPU
Same test.
Same page.
Opposite results.
Shipping the blended number would have actively destroyed desktop revenue, for a brand where desktop drives a significant share of orders.
This happened across all 15 tests.
I'm sharing the exact device split data that changed how we make shipping decisions for every test we run.
Now you can see the full split for yourself.
Here's what's inside:
15 real tests from a top European DTC brand
Full CR, AOV and ARPU results for every test
Complete mobile vs desktop breakdown for each
1. 1. Like this post
2. 2. Comment "SPLIT"
And I'll send it directly to you.
Not sure where your shop leaks?
Book a call and we'll tell you where the money gets lost and what to test first.
Get the free copy
Answer five quick questions and the link is yours.
Step 1
Step 2
Step 3
Step 4
Step 5
What's your email address?
The CRO agency behind 250+ of the world's leading online businesses
Whether high-growth startups or global leaders in e-commerce, travel, insurance, or retail, we consistently drive measurable revenue increases.

















Spend the same on ads.
Make more from them.
Book a call with the team and tell us about your shop. We'll talk through where it stands, where you want it to go, and how we'd get you there. If working with us isn't the best return on your money, we'd tell you rather than take it.
30 minutes, and you'll know exactly where your shop stands.
The Newsletter Read by Employees from Brands like