Drip
Case StudiesProcessApex
Done for youWe run your testing programDone with youYour team runs it in Apex, with our research
BlogResourcesArtifactsStatistical ToolsBenchmarksResearch
See if your shop is a fit
See if your shop is a fitSee if you're a fit
KickzSneaker & Streetwear Retail

How Kickz went from 0.59% to 2.7% conversion rate in 3 years

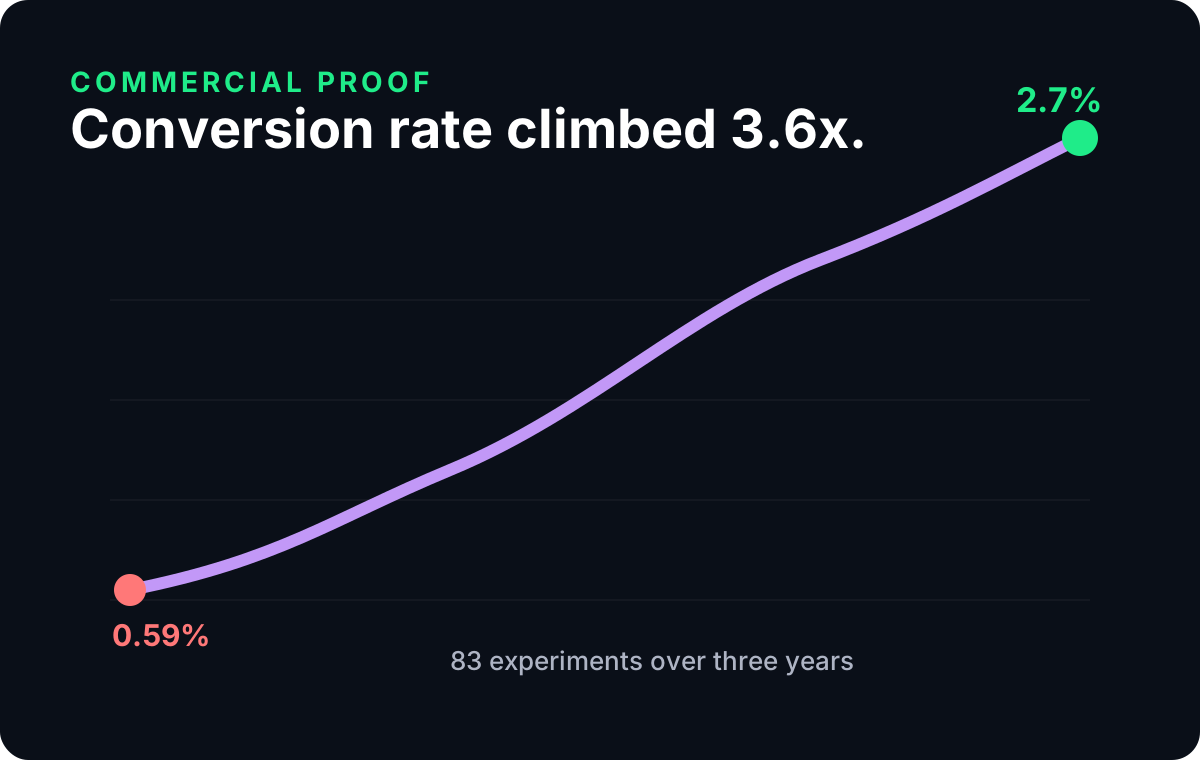
Conversion rate from 0.59% to 2.7% over 3 years. 83 experiments contributed to a successful acquisition.

See if your shop is a fitSee the tests

A free 30-minute call with the team. That's it.

Kickz
3.6×3.6×3.6×Conversion rate
Conversion rate
0.59% → 2.7%0.59% → 2.7%0.59% → 2.7%
Experiments run
838383
Timeframe
3 years3 years3 years

The short version

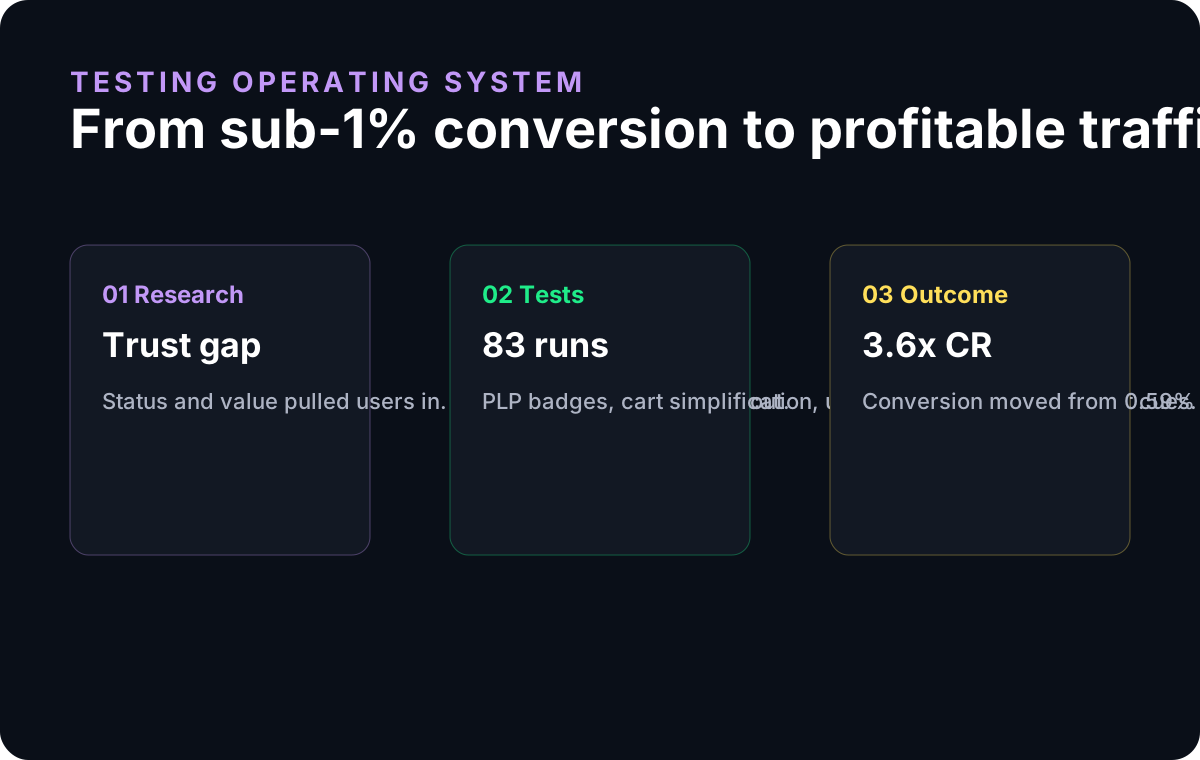
Kickz is a €30M+ annual revenue sneaker and streetwear retailer that was struggling with an extremely low 0.59% conversion rate when we started working together in 2020. Over three years and 83 experiments, we grew their conversion rate to 2.7%, a 3.6x increase. The improved profitability directly contributed to Kickz's acquisition by 11 Teamsports.

From research to the buying experience

Conversion turnaround

A three-year testing system moved conversion rate from 0.59% to 2.7%, changing the economics of paid traffic.

Kickz conversion rate growth chart from 0.59% to 2.7%

The starting point of Kickz

Kickz is a German sneaker and streetwear retailer with over €30M in annual revenue. The brand has a passionate audience and strong brand recognition in the sneaker culture space, but their e-commerce operation was significantly underperforming relative to their traffic and brand equity.

When DRIP began the engagement in 2020, the situation was close to do-or-die. A 0.59% conversion rate meant the brand was struggling to turn a profit from its online operations, with the vast majority of visitors leaving without purchasing.

The challenge

A 0.59% conversion rate is critically low for any e-commerce operation. For context, the industry average for fashion/apparel sits between 1.5-2.5%. Kickz was converting less than one in 170 visitors, meaning over 99% of their traffic was leaving empty-handed.

The brand was spending heavily on acquisition (sneaker culture has an engaged audience across social and search), but the economics simply didn't work at sub-1% conversion. Every channel was unprofitable.

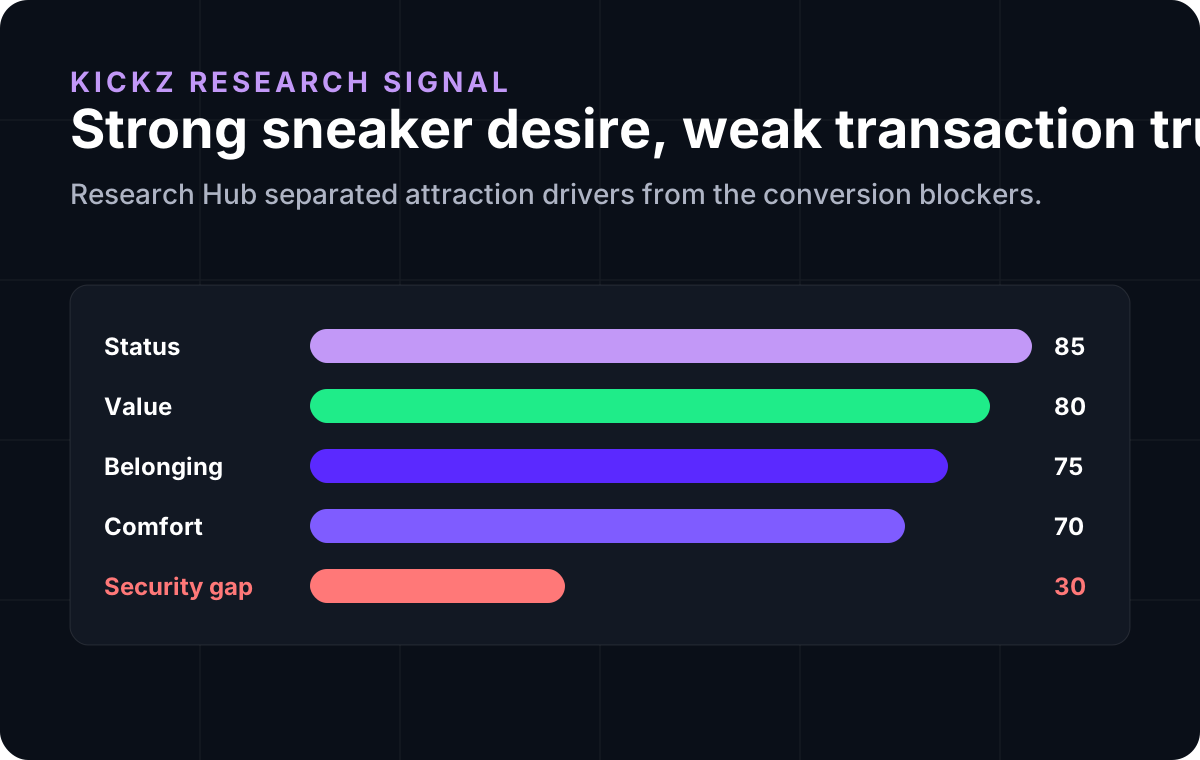
Kickz had strong brand appeal, their Status and Belonging drivers scored high (85 and 80 respectively), pulling in a passionate sneaker community with unique products and competitive pricing. But fundamental trust deficits in the checkout flow were killing conversions. Despite high traffic from the sneaker community, visitors simply weren't converting because the buying experience didn't match the brand promise.

Our process

The work became a research-backed testing system that compounds.

DRIP's method in three steps, and what each step looked like at Kickz.

  1. Kickz driver research map

    Step 1

    Research

    Diagnose why motivated sneaker shoppers still hesitated

  2. Kickz conversion-rate impact chart

    Step 2

    Prediction & prioritization

    Keep the roadmap tied to economic recovery

  3. Kickz testing protocol board

    Step 3

    Parallel testing

    Test trust and speed across the full purchase path

Step 1

Research

Diagnose why motivated sneaker shoppers still hesitated

DRIP's research showed that Kickz already had rare-product pull, price appeal, and community relevance. The key was to identify where trust, stock accuracy, delivery clarity, and control were suppressing purchase confidence.

The most valuable ideas were not just hype mechanics. They were mechanisms that made the transaction feel safer.

Kickz driver research map
Research outputThe model showed why high Status could coexist with very low Security.

Input

Reviews and behavior

Customer language, funnel leakage, and product intent signals.

Model

Driver gap

Status and Value were high; Security and Progress lagged.

Hypothesis

Trust first

Reduce anxiety before adding more urgency.

Step 2

Prediction & prioritization

Keep the roadmap tied to economic recovery

Each result changed the next priority: when trust tests worked, the roadmap moved deeper into checkout and cart; when scanability tests worked, PLP patterns expanded.

The turnaround happened because the testing system learned where the next conversion point was, not because one page was redesigned once.

Kickz conversion-rate impact chart
Commercial proofThe conversion-rate curve shows the value of a multi-year prioritization system.

Readout

Mechanism

Which anxiety or motivation did the test move?

Priority

Exposure

Where can the same mechanism touch more traffic?

Rollout

Economics

Compound the winning patterns into a higher baseline.

Step 3

Parallel testing

Test trust and speed across the full purchase path

The program shipped tests across product listing pages, product pages, cart architecture, cross-sell moments, and checkout flow instead of waiting for one perfect redesign.

At sub-1% conversion, many small friction reductions can create a large economic shift.

Kickz testing protocol board
Testing roadmapThe roadmap tied each experiment to trust, speed, value, or sneaker-culture motivation.

PLP

Scan faster

Badges and pagination made product choice easier.

Cart

Remove branches

Cart drawer consolidation reduced unnecessary page movement.

Checkout

Preserve confidence

Trust cues reduced the anxiety created by unreliable expectations.

What the research found

DRIP's research showed that order reliability, delivery, price clarity, and returns were the practical drivers behind the sneaker-culture conversion problem.

#Purchase driverDriver scoreMentionsSentimentpositiveneutralnegative
1

Order Fulfillment & Stock Accuracy

Trust

Shoppers needed confidence that ordered products were truly available and would be delivered.

Driver score95
Mentions40
Sentiment12% positive18% neutral70% negative
2

Delivery Speed

Core functionality

Fast delivery was a positive driver, but inconsistency turned it into anxiety.

Driver score90
Mentions90
Sentiment52% positive18% neutral30% negative
3

Product Price & Sales

Economic

Competitive pricing and sales were strong purchase triggers when stock confidence was preserved.

Driver score80
Mentions20
Sentiment68% positive20% neutral12% negative
4

Product Quality & Condition

Product quality

Collectors cared about originality, condition, and packaging integrity.

Driver score75
Mentions30
Sentiment44% positive28% neutral28% negative
5

Returns & Refund Process

User experience

Return clarity reduced perceived downside for high-consideration sneaker purchases.

Driver score70
Mentions25
Sentiment25% positive25% neutral50% negative

What it meant for the roadmap

  1. 1

    Strong brand pull met low confidence

    Desire alone was not enough when the transaction felt uncertain.

  2. 2

    Stock and fulfilment decided purchases

    These topics had to build trust inside the visible buying path.

  3. 3

    Price and exclusivity supported intent

    They only worked when the order itself felt reliable.

  4. 4

    The turnaround came from many experiments

    The roadmap connected listings, cart and checkout instead of betting on one relaunch.

Kickz research and testing protocol board
Testing protocolThe CRO job was to convert sneaker-culture demand with more trust, clearer product paths, and lower checkout effort.

What the actual tests looked like

Test 1 of 3

Remove Cart Page & Add Upsell to Cart Drawer (Desktop)

Removed the separate cart page entirely and consolidated the purchase flow into a streamlined cart drawer with a single CTA and an upsell section. Leveraged cognitive ease, analysis paralysis reduction, and decision simplification while increasing cross-sell exposure.

Separate cart page with multiple CTAs → Streamlined cart drawer with single CTA and upsell section+14.2% RPU

Test 2 of 3

Hot & Bestseller Badges on Product Listing Pages

Added 'Hot' and 'Bestseller' badges to hype and release products on PLPs, creating immediate social proof and urgency signals. Tapped into attentional bias, scarcity, and the bandwagon effect to drive click-through and purchase intent.

Plain product tiles with no differentiation → Eye-catching badges highlighting trending and bestselling products+13.9% RPU

Test 3 of 3

Replace Infinite Scroll with Pagination on PLPs

Replaced the 'load more' infinite scroll pattern with traditional pagination on product listing pages. Gave users a greater sense of control and autonomy over browsing, reducing cognitive load and simplifying the decision process.

Infinite scroll with 'Load More' button → Traditional numbered pagination+10.3% RPU

Overall impact

Over three years, DRIP ran 83 experiments with 26 winners, a 31% win rate, systematically optimizing every stage from browsing to checkout. Kickz's conversion rate grew from 0.59% to 2.7%, a 3.6x increase that transformed the business economics.

The improved conversion economics made previously unprofitable acquisition channels viable, and the improved unit economics directly contributed to Kickz's successful acquisition by 11 Teamsports.

The partnership continues today, with optimization efforts ongoing under the new ownership structure.

The takeaway

The Kickz case shows that even brands with critically low conversion rates can achieve dramatic turnarounds, but it requires patience and systematic execution. A 3.6x improvement doesn't happen overnight; it's the result of 83 experiments compounding over three years.

For retailers struggling with sub-1% conversion rates: the opportunity cost of not testing is enormous. Every day at 0.59% CR when you could be at 2.7% represents massive lost revenue on the same traffic.

The acquisition outcome also highlights an underappreciated benefit of CRO: it directly increases company valuation by improving the fundamental economics of the business.

DRIP and Apex

Spend the same on ads.
Make more from them.

Book a call with the team and tell us about your shop. We'll talk through where it stands, where you want it to go, and how we'd get you there. If working with us isn't the best return on your money, we'd tell you rather than take it.

See if your shop is a fit

30 minutes, and you'll know exactly where your shop stands.

More case studies

SNOCKS

€8.2M+ additional revenue

How SNOCKS scaled from €2M to €90M a year

Read case study →
KoRo

€2.56M in 6 months

How KoRo added €2.56M in 6 months by turning first-time A/B testing into a research engine

Read case study →
Giesswein

€12.2M over 3 years

How Giesswein added €12.2M in revenue after a post-COVID drop

Read case study →

The Newsletter Read by Employees from Brands like

LEGONikeTeslalululemonPelotonSamsungBoseIKEA

Join 17,000+ Ecom founders turning CRO insights into revenue

Trusted by 250+ brands

  • Strauss
  • Koro
  • Sunday Natural
  • The Body Shop
  • Grover
  • Hello Fresh
  • Natural Elements
  • AG1
  • Bluebrixx
  • Woom
  • Hornbach
  • Tourlane
  • Congstar
  • Holy
  • Junglück
  • PV
  • Wunschgutschein
  • Motel A Mino
  • Ryzon
  • Kickz
  • The Female Company
  • Livefresh
  • Schiesser
  • Horizn Studios
  • Seeberger
  • Luca Faloni
  • Zahnheld
  • Snocks
  • Bruna
  • NatureHeart
  • Priwatt
  • Jumbo
  • NKM
  • Oceansapart
  • Omhu
  • Blackroll
  • 1 Kom Ma 5
  • Purelei
  • Giesswein
  • T1tan
  • Buah
  • Ironmaxx
  • Waterdrop
  • Send a Friend
  • Fitjeans
  • Mofakult
  • Plantura
  • BGA
  • Coop
DRIP / Apex

Prediction-based experimentation for online shops from €100k a month.

See if your shop is a fit

Company

  • About us
  • Case studies
  • Process
  • Careers
  • Experts
  • Media
  • Reviews

Services

  • Done for you
  • Done with you
  • CRO agency
  • A/B testing agency
  • Shopify CRO

Apex

  • Apex
  • How we built the genome
  • Log in
  • Docs

Resources

  • Blog
  • Resources
  • Research
  • Benchmarks
  • Statistics tools
  • Best A/B testing tools
© 2026 Drip Trading GmbH
ImprintPrivacyTerms

Cookies

We use optional analytics and marketing cookies to improve performance and measure campaigns. Privacy Policy