Drip
Case StudiesProcessCareers
Conversion Optimization LicenseCRO Audit
BlogResourcesArtifactsStatistical ToolsBenchmarksResearch
Book Your Free Strategy CallBook a Call
All Case Studies
Oceansapart logoAthletic & Activewear DTC
DRIP Growth Protocol / Oceansapart

How Oceansapart added €323K/month from zero data.

A turnaround program built when historical analytics were missing, using research-first hypotheses and live experiments to create 18 winning tests in six months.

Book Your Free Strategy Call
See the protocol
Activewear turnaroundThe work focused on rebuilding confidence in the buying journey: product proof, sizing clarity, discount trust, and better paths for high-intent shoppers.
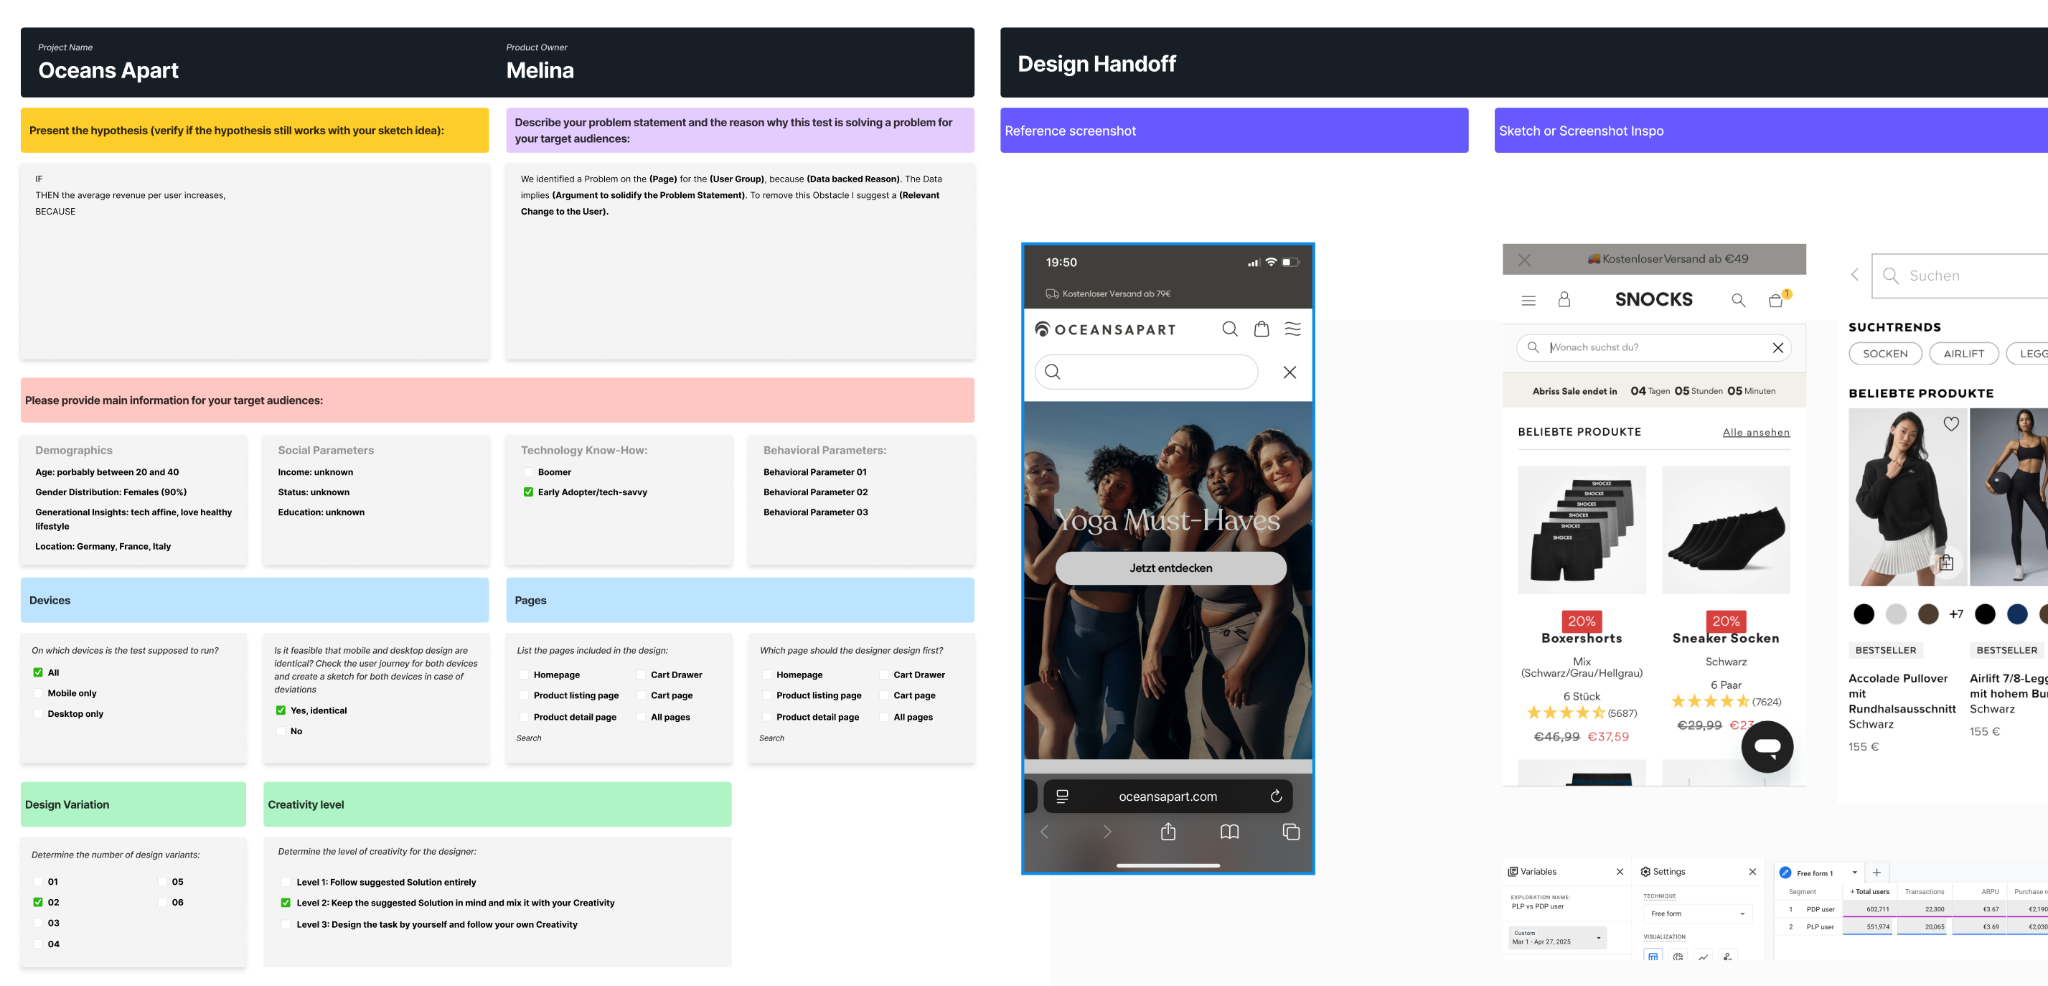
Design prototypesTests were designed with concrete page changes, mobile and desktop states, and client-reviewable prototypes.
Testing SOPExecution connected research, ideation, ticket writing, hypothesis creation, statistics, and interpretation.
live
Growth mapSignals move from raw behavior into a tested roadmap.
live
Test 1
Test 2
Test 3
Winner rollout
Test velocityParallel tests compound learning instead of waiting in sequence.
+€323KMonthly Revenue Added
18Winning Tests
6 MonthsTimeframe
1.48%Starting CR
ZeroStarting Data
BrandOceansapart
Primary outcome+€323K Monthly Revenue Added
Evidence base18 Winning Tests
Timeframe+€323K Monthly Revenue Added
The short version

Oceansapart is an athletic and activewear DTC brand that was under serious financial pressure when DRIP began the engagement. Recent shop migrations had wiped out all historical analytics — GA4, Meta, and ad tracking were barely installed. Starting from a 1.48% conversion rate with zero usable data, we built a testing program that generated +€323,923/month across 18 winning tests in just six months, surpassing the 10% uplift guarantee ahead of schedule.

Oceansapart evidence stack

Research did not stay abstract. It became visible work.

Each case-study layer now keeps the artifacts in the page: current shop screenshots, research boards, prioritization outputs, test evidence, and impact charts.

ResearchTestsPriorityRevenue
01Research diagnosis

When tracking was broken, research maps replaced waiting for perfect analytics

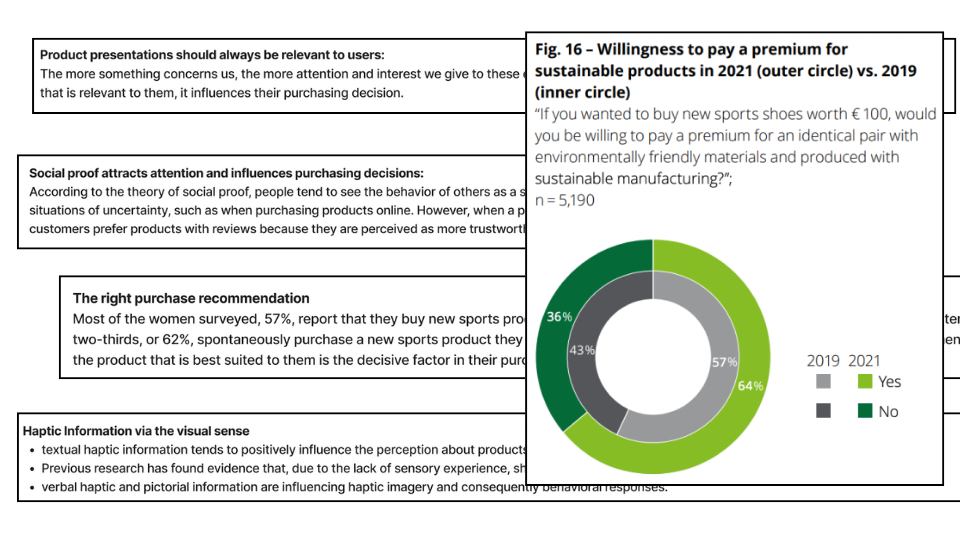
Research mapThe research map connected confidence, fit, value perception, discovery, and test opportunities before clean analytics existed.
02Roadmap system

Research, design, QA, and measurement moved together

Design prototypesTests were designed with concrete page changes, mobile and desktop states, and client-reviewable prototypes.
01Proof and fit

The roadmap started with missing data and ended with measured winners.

The work turned a thin analytics foundation into a usable research and testing system for the relaunch.

Six-month turnaround proofThe turnaround program added +€323K per month from 18 winning tests while the data foundation was being rebuilt.
02The Brand

Why Oceansapart needed a sharper growth system.

Oceansapart is a DTC athletic and activewear brand that had been through a turbulent period. After being acquired by SNOCKS out of insolvency, the brand was under serious pressure to demonstrate that the e-commerce operation could become profitable.

The situation was made significantly more complex by recent shop migrations that had effectively wiped out all historical analytics data. GA4 wasn't properly configured, Meta tracking was incomplete, and ad attribution was unreliable. The team was essentially flying blind.

03The Challenge

The conversion problem behind the headline.

The challenge was three-dimensional. First, the conversion rate sat at 1.48% — workable, but leaving significant revenue on the table. Second, the brand couldn't change the economy or consumer behavior — the only lever was optimizing what they controlled on-site. Third, and most critically: they had zero usable data to build from.

Most CRO agencies would have spent months getting analytics set up, running baseline measurements, and building a data foundation before testing anything. Oceansapart didn't have months. The financial pressure demanded results now.

Behavior model under zero-data constraints

When tracking was broken, research maps replaced waiting for perfect analytics

Oceansapart had pressure from the acquisition, thin resources, a discount-trained customer base, and almost no usable analytics. Instead of pausing for months, we used research maps, motivation rankings, and psychology models to identify where shoppers needed more confidence.

1.48%Starting conversion rate
0Usable historical data
3Predictive research layers
Research mapThe research map connected confidence, fit, value perception, discovery, and test opportunities before clean analytics existed.
Motivation rankingMotivation ranking helped decide whether a test should address fit confidence, value clarity, body image, or product trust.
Psychology chartPsychology modeling gave each early test a mechanism even though the historical tracking base was weak.
04The Approach

The work became a research-backed testing system.

We took a research-first approach that didn't depend on historical data. Consumer psychology research — qualitative analysis of reviews, competitor positioning, and user behavior patterns — gave us the foundation we needed without relying on historical analytics.

From there, we built and launched experiments using real-time data collection. Each test generated its own baseline and measurement framework, allowing us to build the data infrastructure simultaneously with the testing program.

The key insight was that you don't need two years of analytics history to start testing. You need a deep understanding of customer psychology, a clear hypothesis framework, and the ability to move fast. We had all three.

Execution system

Research, design, QA, and measurement moved together

The team did not wait for a perfect dashboard. We built briefs, variants, prototypes, QA routines, and measurement discipline in parallel so the program could ship clean tests while rebuilding confidence in the data.

35Tests run
18Winning tests
51.43%Testing win rate
Design prototypesTests were designed with concrete page changes, mobile and desktop states, and client-reviewable prototypes.
Testing SOPExecution connected research, ideation, ticket writing, hypothesis creation, statistics, and interpretation.
RoadmapThe roadmap made priorities visible to product, marketing, and leadership while the turnaround was underway.
05DRIP Growth Protocol

How we built a growth system without waiting for perfect data

Oceansapart needed a turnaround system, not a slow analytics project. The brand had pressure, thin resources, discount-trained customers, and almost no usable historical data. We used the DRIP Growth Protocol to replace guesswork with predictive research, launch a high-velocity testing engine, and let every result rebuild the data foundation.

live
VisitClickAddBuy
Predictive researchAttention, objections, and buying motivations narrow into sharper hypotheses.
live
Test 1
Test 2
Test 3
Winner rollout
Rapid testingMultiple active tests create more valid shots on goal.
live
PDP92
Cart84
PLP73
Search61
Email44
Iterative prioritizationThe highest-value evidence gets promoted into the next sprint.
Quality of TestPredictive Consumer Research

Use psychology, reviews, research models, and the 2,500-test database before historical analytics exist

Rate of TestingRapid A/B Testing

Ship many small, high-probability improvements across PDP, PLP, cart, homepage, and sold-out states

Success RateIterative Prioritization

Score every idea by revenue exposure, ease, evidence strength, and learned win patterns

OutputCompounding learning

Every validated change raises the next baseline and teaches the next sprint what to test.

01Predictive Consumer Research

Build customer understanding without waiting months for perfect tracking.

We used Research Hub, customer and product reviews, academic literature, competitor patterns, and our 2,500+ experiment database to model what would matter for Oceansapart shoppers. The focus was not abstract fashion inspiration. It was confidence: fit, value, body image, product benefits, and trust after the ownership change.

Operating insight

Oceansapart did not need more opinions. It needed a research model strong enough to act before analytics history existed, then a way to validate the model with live tests.

2.5K+Experiment database
200+Brands benchmarked
40h+Session review depth
InputReviews, behavior, benchmarks

We combined customer reviews, product signals, early analytics, expert research, and known fashion-test patterns.

ModelConfidence before conversion

The buyer model prioritized fit certainty, value clarity, product proof, and low-friction discovery.

OutputDay-one test backlog

Research produced hypotheses that could launch before months of clean analytics existed.

Persona hypothesesReview miningAcademic evidenceFunnel questionsPDP/PLP research backlog
ClarityEasy navigation, clear categories, direct product information
91
Body confidenceFit guidance, product proof, and less uncertainty
86
Value trustSavings shown clearly without relying on heavy discount theatre
82
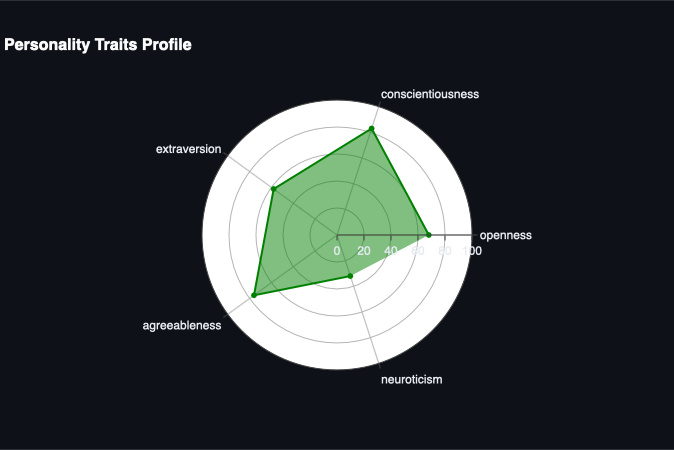
Personality profileResearch mapped how the customer evaluates clarity, novelty, emotional certainty, and product trust.
Academic evidencePeer-reviewed and expert research helped pressure-test test ideas before they reached design.
02Rapid A/B Testing

Run small, sharp experiments while the analytics foundation is being rebuilt.

Instead of waiting for a perfect tracking setup, we built tests that created their own baselines. The first wave focused on high-exposure ecommerce surfaces: PDP benefit proof, price display, bestseller cues, homepage product order, PLP banners, sold-out recovery, and cart behavior.

Operating insight

The fastest path was not a full redesign. It was a sequence of tightly scoped improvements where each win could add monthly profit immediately.

35Tests run
18Winners
51.43%Win rate
ScopeSmall changes, high exposure

Each test targeted a visible revenue surface where a small behavioral fix could move monthly profit.

BuildVariants, prototypes, QA

Design briefs, 3-5 variants where needed, clickable prototypes, and QA kept velocity high without messy execution.

MeasureLive baseline creation

Tests generated the data foundation Oceansapart was missing while still producing immediate wins.

PDP proofPLP confidence cuesCart pricing clarityHomepage order effectsSold-out recovery
PDP optimizations+€158,345/month
88
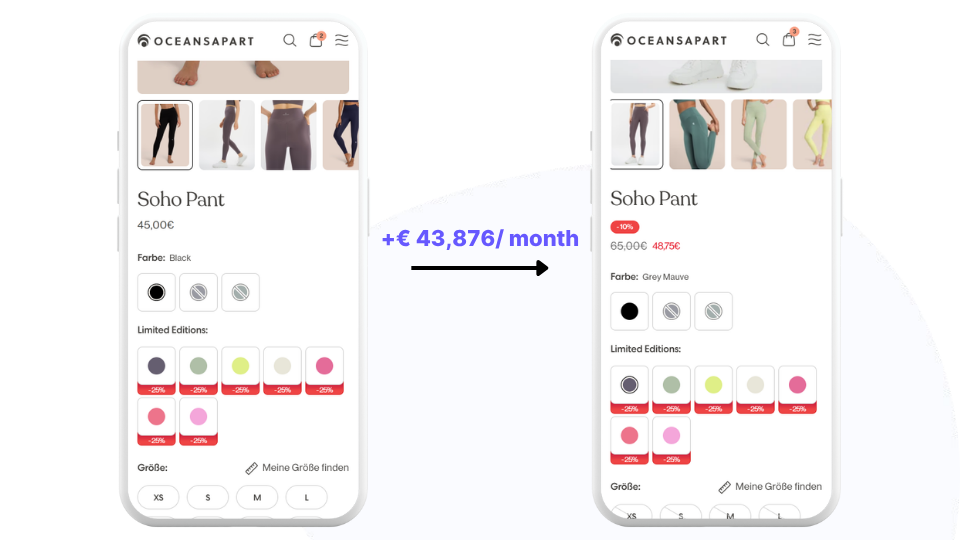
Discount display+€43,876/month
79
PDP benefit subline+€28,934/month
68
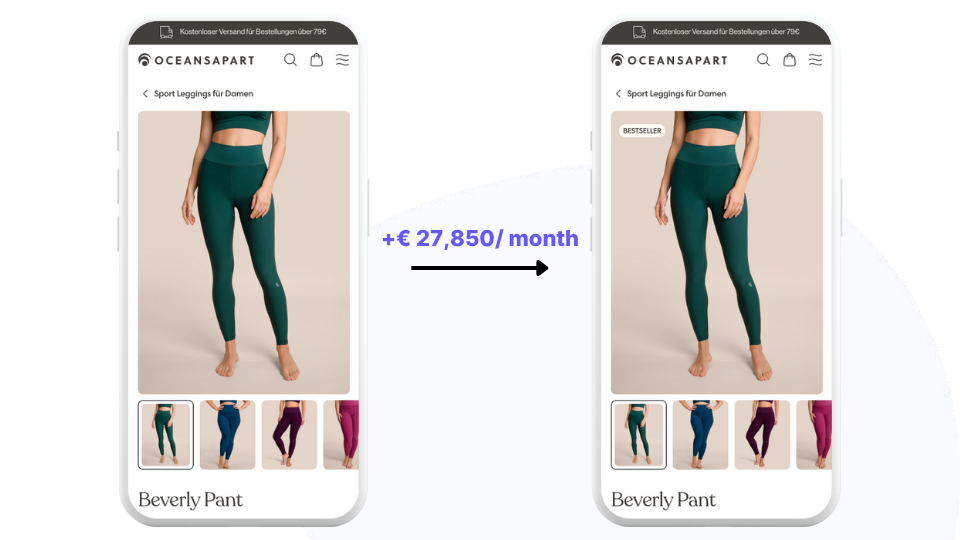
Bestseller badgeBestseller cues added fast social proof on PLP and PDP without changing the whole page.
Discount displayPricing clarity across PLP, PDP, and cart drawer helped shoppers understand the offer instantly.
Sold-out recoverySimilar products redirected demand that previously ended at an unavailable variant.
03Iterative Prioritization

Keep the roadmap accountable to revenue exposure, ease, and live learning.

After ideation, the real work was deciding what should ship first. We filtered the prioritization engine by relevant apparel and wellness patterns, then scored ideas by page exposure, scroll depth, research indicators, implementation cost, and the win patterns from the 2,500+ test database.

Operating insight

This is where turnaround CRO becomes disciplined. The roadmap made progress, ROI, and learning visible to product, marketing, and leadership while the business was under pressure.

+€323KMonthly revenue added
€17.9KAvg monthly revenue per winner
26Running + pipeline tests
PrioritizeRevenue exposure first

Ideas were scored by how much traffic and revenue they could influence, not by how exciting they sounded.

SequenceHighest confidence, lowest waste

The roadmap balanced upside, implementation effort, research signal, and known win patterns.

CompoundPipeline never stops

With 12 tests running and 14 in the pipeline, every result fed the next round of priorities.

Revenue exposureResearch strengthEase of implementationExpected upsideRoadmap accountability
Testing roadmapIdeas were grouped into a visible roadmap so every team could see what was being tested, why it mattered, and how it connected to business goals.
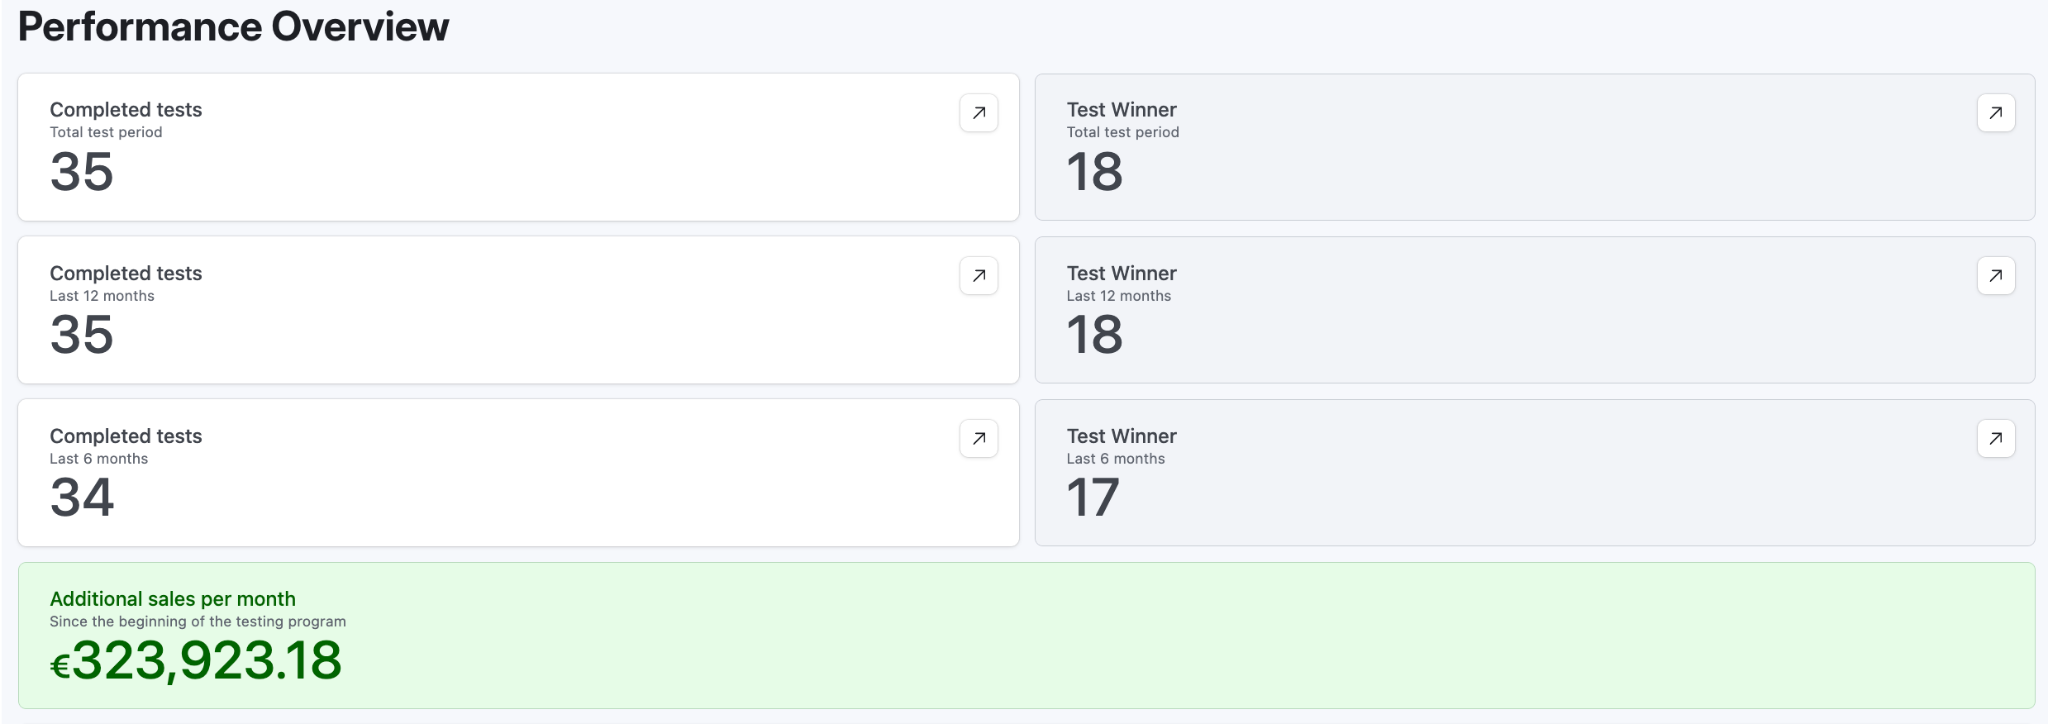
Performance overviewSix months in: 35 tests, 18 wins, 51.43% win rate, and +€323,923.18/month.
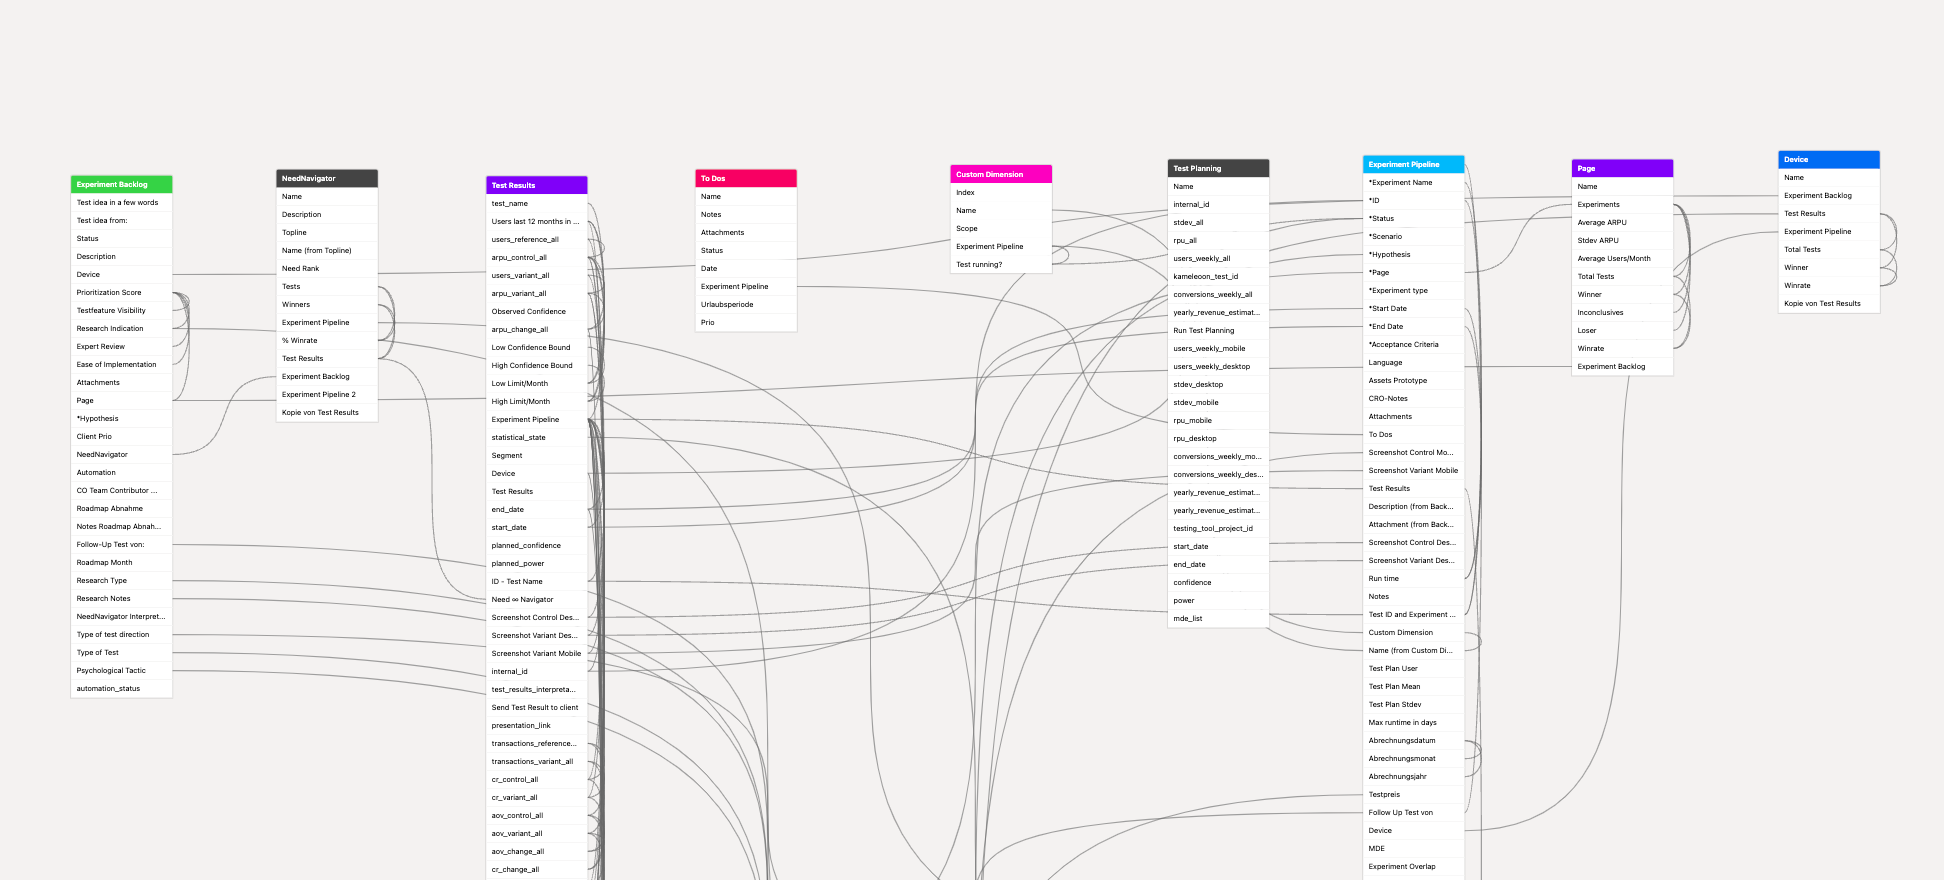
Testing SOPResearch, ideation, tickets, hypothesis writing, statistics, and interpretation were connected in one operating system.
Starting condition0 data

Recent migrations and privacy constraints left the team with almost no usable historical analytics.

Waiting for a clean baseline would have wasted the most valuable turnaround window.
Commercial pressure+€43.9K/mo

Customers had been trained to buy through heavy discounting, making value perception fragile.

The page had to make savings feel clear and trustworthy without teaching the customer to wait for bigger codes.
Activewear PDP+€158K/mo

Product pages needed stronger reasons to believe: benefits, fit, bestseller proof, and clearer action hierarchy.

For activewear, confidence is emotional and functional: shoppers need to picture the garment on their body before they commit.
Lost intent+21.7% RPU

Sold-out product states were turning demand into dead ends instead of keeping shoppers in the assortment.

When size or color availability breaks the purchase path, the next-best product must appear immediately.

Predictive research output: the first revenue leaks to attack

Because the brand had no usable history, we treated each revenue leak as a research-backed hypothesis. The priority was fast profit, but not random quick wins: every test had to reduce uncertainty, improve value perception, or keep purchase intent alive.

1

PDP confidence and benefit clarity

Product Proof

A+ content, benefit sublines, bestseller cues, ATC layout, and sticky-ATC changes made the PDP easier to trust and act on.

6 mentions58% pos24% neu18% neg
91%Importance
2

Discount price comprehension

Value Perception

Heavy discount culture made price display a conversion risk. The offer had to be instantly legible across PLP, PDP, and cart drawer.

3 mentions32% pos28% neu40% neg
88%Importance
3

Fit and size confidence

Body Confidence

Activewear shoppers need confidence that the garment will fit, flatter, and perform before they commit.

4 mentions45% pos35% neu20% neg
84%Importance
4

Sold-out path recovery

Assortment Flow

Unavailable variants were leaking demand. Alternative product suggestions kept high-intent shoppers moving.

2 mentions28% pos18% neu54% neg
81%Importance
5

Homepage and PLP discovery order

Merchandising

Category order, bestseller placement, and collection banners shaped browsing before product-level decisions happened.

5 mentions50% pos32% neu18% neg
76%Importance
06Key Tests & Results

What the actual tests looked like.

The page keeps the real control, variant, and result screenshots so the case study shows the evidence behind each claim.

Display Alternative Product Suggestions for Sold-Out Products

When a variant is sold out, we added a 'Similar Products' section below the Notify Me button to redirect purchase intent instead of losing it. Leverages choice architecture and frustration reduction — giving shoppers an immediate alternative rather than a dead end.

Dead-end sold-out state → 'Similar Products' recommendation section below Notify MeCR +11.6%, RPU +21.7%
Sold-out recovery

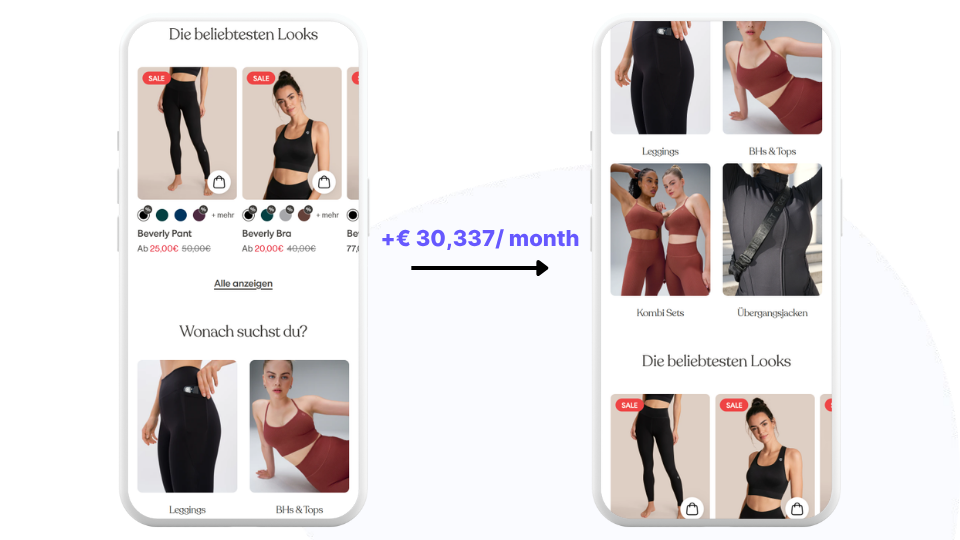
Move Bestseller Slider Below Product Category Section on Homepage

Repositioned the bestseller slider below the category section on the French market homepage so users browse categories first, then see bestsellers in context. Uses contextual relevance and order effects — category browsing primes intent before bestseller social proof reinforces it.

Bestseller slider above categories → Bestseller slider below categories for contextual relevanceCR +10.4%, RPU +13.8%
Bestseller proof

Interactive Size Guide Tool Instead of Static Size Table on PDP

Replaced the traditional static size chart with an interactive Sizekick recommendation tool behind a 'Find My Size' link. Reduces sizing uncertainty through cognitive ease and personal relevance — shoppers get a tailored recommendation instead of interpreting a generic table.

Static size chart → Interactive size recommendation toolCR +8.0%, RPU +10.0%
PDP confidence

Discount Price Display Across PLP, PDP, and Cart

Changed how discounted prices were displayed across the buying journey so shoppers understood the real offer without mental math or discount-code confusion. This directly addressed Oceansapart's discount-trained demand problem.

Ambiguous discount math → clear crossed price and final price display+€43,876/month
Pricing clarity

PDP Benefit Subline

Added a concise product subline summarizing the top two benefits directly on the PDP. The change made the product promise visible at the decision point instead of burying the reason to believe lower on the page.

Generic PDP header → PDP header with top benefit subline+€28,934/month
Benefit clarity
Overall Impact

The output was not a nicer website. It was a better revenue system.

In six months, the program delivered +€323,923 in monthly additional revenue across 18 winning tests. This surpassed DRIP's standard 10% revenue per user uplift guarantee well ahead of schedule.

Starting from zero data to this level of impact in half a year demonstrates that the speed of results is primarily determined by the quality of the research and testing methodology, not by how much historical data you have available.

The engagement also established the analytics infrastructure that Oceansapart was missing — meaning the data generated by the tests themselves became the foundation for ongoing optimization.

The Takeaway

The advantage came from compounding learning.

The Oceansapart case destroys a common myth in CRO: that you need months of data collection before you can start testing. You don't. What you need is a research methodology that generates insights independent of historical analytics — and the ability to build the measurement framework as you go.

For brands in turnaround situations or post-migration: don't wait for perfect data. A research-first approach using consumer psychology can generate actionable hypotheses from day one. The 18 winning tests in six months prove that pace doesn't have to mean recklessness — it can mean precision at speed.

The financial impact — €323K/month — also shows that CRO can be the fastest lever available to brands under pressure. Unlike brand campaigns or new product development, conversion optimization impacts existing traffic immediately.

08More Results

More results from the same operating model.

SNOCKS logo
SNOCKS
€8.2M additional revenue
KoRo logo
KoRo
€2.56M in 6 months
Kickz logo
Kickz
3.6x conversion rate
Build the testing engine

Want Results Like This?

Book a free strategy call and we'll show you what psychology-driven CRO can do for your brand.

Book Your Free Strategy Call

The Newsletter Read by Employees from Brands like

Lego
Nike
Tesla
Lululemon
Peloton
Samsung
Bose
Ikea
Lacoste
Gymshark
Loreal
Allbirds
Join 12,000+ Ecom founders turning CRO insights into revenue
Drip Agency
About UsCareersResourcesBenchmarks
ImprintPrivacy Policy

Cookies

We use optional analytics and marketing cookies to improve performance and measure campaigns. Privacy Policy