01What Is Minimum Detectable Effect?
Minimum Detectable Effect is the sensitivity threshold of your A/B test. It answers a precise question: what is the smallest real difference between control and variant that this test will reliably pick up? If the true effect is smaller than your MDE, the test does not have enough statistical power to distinguish it from noise — regardless of how long you run it at the planned sample size.
Think of MDE as the resolution of a microscope. A 10x lens can see large cells but misses bacteria. A 1000x lens sees everything but requires a fundamentally different setup. In A/B testing, that setup is sample size. The smaller the effect you want to detect, the more data you need — and the relationship is not linear.
These numbers from DRIP's data across thousands of experiments tell a clear story: most winning A/B tests produce modest uplifts. If your test is designed to detect only 10% relative improvements, you are blind to the majority of real value your testing program could capture.
02Why MDE Matters More Than You Think
The relationship between MDE and sample size follows an inverse-square law. This means small changes in your MDE target create massive differences in how long tests need to run. Most teams underestimate this relationship, leading to one of two failure modes: tests that drag on for months (MDE too small) or tests that miss real winners (MDE too large).
| MDE (Relative) | Sample per Variant | ~Duration at 50k visitors/month |
|---|---|---|
| 1% | ~3,500,000 | 140 weeks |
| 2% | ~875,000 | 35 weeks |
| 5% | ~140,000 | 5.6 weeks |
| 10% | ~35,000 | 1.4 weeks |
The cost of getting MDE wrong flows in both directions. An MDE that is too ambitious for your traffic level means tests run for months, your testing velocity collapses, and stakeholders lose patience with the program. An MDE that is too lenient means you are only detecting large effects — the obvious wins — while systematically missing the compounding small improvements that drive long-term growth.
This is the central trade-off in experimentation program design. You are balancing sensitivity (ability to detect small effects) against velocity (number of experiments per year). The optimal MDE sits at the intersection of what your traffic can support and what your business needs to detect.
03What Effect Sizes Are Realistic in E-Commerce?
Before you set your MDE, you need to understand the distribution of real effect sizes in e-commerce. This is where most teams go wrong — they anchor on case studies showing 30% or 50% uplifts and assume those outcomes are normal. They are not. They are survivorship-biased outliers.
| Effect Size Bucket | % of Winners | Cumulative % |
|---|---|---|
| 0 – 1% relative | 18% | 18% |
| 1 – 3% relative | 37% | 55% |
| 3 – 5% relative | 20% | 75% |
| 5 – 10% relative | 16% | 91% |
| 10%+ relative | 9% | 100% |
The data is unambiguous: 55% of winning experiments produce less than 3% relative uplift, and 75% produce less than 5%. The winners above 10% exist, but they are fewer than one in ten. If your testing program can only detect effects of 5% or larger, you are systematically discarding three-quarters of your real wins.
04How to Calculate the Right MDE for Your Store
There is no universal correct MDE. The right value depends on your traffic, your baseline metrics, and your business context. But there are two practical frameworks for arriving at the right number — one works backward from your traffic, the other works backward from your revenue.
The Business-First Approach
Start with your monthly unique visitors and determine the maximum test duration your organization will tolerate — typically 4 to 6 weeks. Multiply your weekly traffic by your maximum weeks to get the total available sample. Then use a standard power calculation to determine the smallest effect size detectable at 80% power and 5% significance, given that sample and your baseline conversion rate.
For example, a store with 200,000 monthly visitors and a 3% baseline conversion rate can detect a relative MDE of roughly 3.5% in a 4-week test at 80% power. That is your floor — you cannot reliably detect anything smaller without extending the test or increasing traffic.
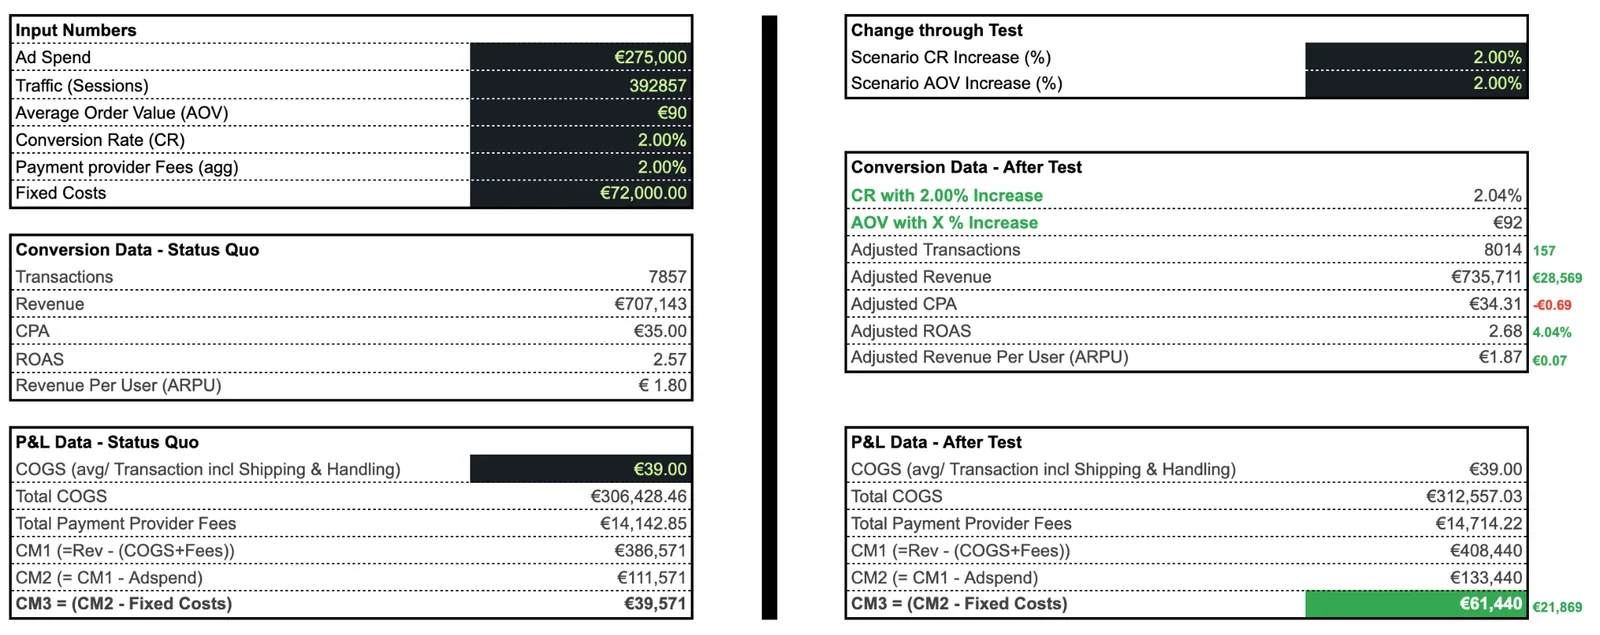
The Revenue-First Approach
Start with the smallest uplift that would be worth implementing. Calculate the annualized revenue impact of a 1%, 2%, and 5% relative conversion rate improvement. If a 2% uplift adds EUR 50,000 in annual revenue and the cost of implementation is EUR 5,000, the ROI is clear — you should set your MDE to detect that 2% improvement. If your traffic cannot support it, that is a constraint to solve, not a reason to raise your MDE.
- Determine your baseline conversion rate — use a full 4-week period to account for weekly cycles. Use the specific page or funnel step you are testing, not the site-wide average.
- Set your maximum test duration — 4 weeks is the sweet spot for most stores. Going beyond 6 weeks introduces cookie expiration, seasonality, and stakeholder fatigue.
- Calculate available sample per variant — divide your eligible traffic by the number of variants (typically 2). Only count visitors who actually see the test — not total site traffic.
- Run the power calculation backward — input your baseline rate, sample per variant, 80% power, and 5% significance. The output is your achievable MDE.
- Compare to your revenue threshold — if the achievable MDE is larger than the smallest effect worth detecting, you have a gap. Close it with more traffic, longer duration, or variance reduction techniques like CUPED.
05MDE and Metric Selection
MDE is not just about traffic — it is about the variance of your chosen metric. A metric with high variance (large spread around its mean) requires more observations to distinguish a signal from noise. This is why revenue per visitor, despite being a more complete measure of business impact, is harder to move with statistical confidence than conversion rate.
Revenue per visitor is affected by both conversion probability and order value. A single high-value order can swing RPV dramatically, inflating variance. Conversion rate, by contrast, is binary (0 or 1 per visitor) and has inherently lower variance at typical e-commerce conversion rates. The practical implication: the same test that can detect a 3% relative MDE on CR may only detect a 6-8% relative MDE on RPV.
| Metric | Relative Variance | Typical Achievable MDE | Trade-off |
|---|---|---|---|
| Conversion Rate | Low | 3 – 5% | Misses AOV effects |
| Revenue per Visitor | High | 6 – 10% | Captures full revenue impact |
| Average Order Value | Medium-High | 5 – 8% | Only measures buyers, smaller sample |
| Add-to-Cart Rate | Low-Medium | 2 – 4% | Higher-funnel, more observations |
The practical recommendation: use conversion rate as your primary metric for statistical power, but always monitor RPV as a guardrail. If a variant lifts CR but tanks RPV, you are converting more low-value buyers — a net negative. If a variant lifts RPV but not CR, you may be missing a real revenue improvement because CR was not sensitive enough to capture it.
06Common MDE Mistakes
- Setting MDE too ambitiously for your traffic
- Confusing MDE with expected or observed effect size
- Ignoring metric variance when choosing MDE
- Using the same MDE for every test regardless of context
- Not recalculating MDE when traffic or baseline rates change
Setting MDE too ambitiously. Targeting a 1% MDE when your site gets 50,000 monthly visitors means tests that would take over a year to complete. No organization sustains that cadence. An MDE of 1% is achievable only for sites with millions of monthly visitors. For everyone else, it is a theoretical aspiration that kills testing velocity in practice.
Confusing MDE with expected effect size. MDE is not a prediction — it is a sensitivity threshold. If you set your MDE at 5%, you are not saying you expect a 5% lift. You are saying your test is designed to detect effects of 5% or larger. If the true effect is 3%, a test with a 5% MDE will likely call it inconclusive — even though the effect is real and profitable.
Ignoring metric variance. Two metrics can have the same mean but wildly different variances. A 3% MDE on conversion rate is not equivalent to a 3% MDE on revenue per visitor. If you do not account for the variance of your chosen metric, your power calculation will be wrong and your test will be either overpowered (wasting time) or underpowered (missing effects).
Using one MDE across all tests. A radical checkout redesign should be held to a different standard than a button-color test. High-effort, high-risk changes warrant lower MDEs (higher sensitivity) because the cost of missing a real degradation is greater. Low-effort tweaks can tolerate higher MDEs because the cost of a false negative is limited to the small implementation effort.
Not recalculating when conditions change. Your traffic shifts seasonally. Your baseline conversion rate changes as you deploy winners. Your metric variance shifts as your product mix evolves. An MDE that was appropriate six months ago may no longer be achievable — or may now be unnecessarily conservative. Recalculate at least quarterly.
For a deeper understanding of how power and MDE interact, see our guide on statistical power in A/B testing.