4.3 million A/B tests from 151,000 shops
Our 10 best A/B tests, backed by 4.3 million tests
Ten tests shops kept more often than the average test, for more revenue from the traffic you already pay for.



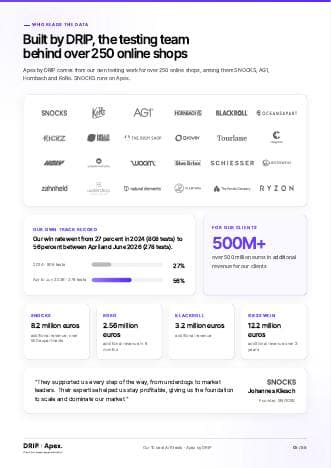
Over 250 online shops have tested with DRIP
Track record
Over 500 million euros in additional revenue for our clients











- 27% to 56%DRIP win rate, from 2024 (808 tests) to April to June 2026 (278 tests)
- 4.3MA/B tests in the database, collected since 2011
 €8.2Madditional revenue from over 550 experiments
 €443,466more revenue per month
 0.59% to 2.7%conversion rate in 3 years, 83 experiments
 €2.56Madditional revenue in 6 months, plus 10 percent conversion
Inside the PDF
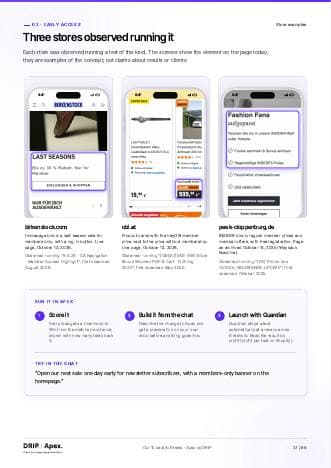
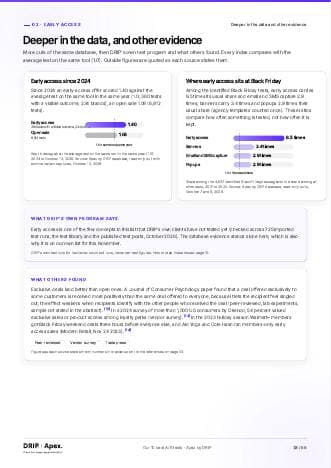
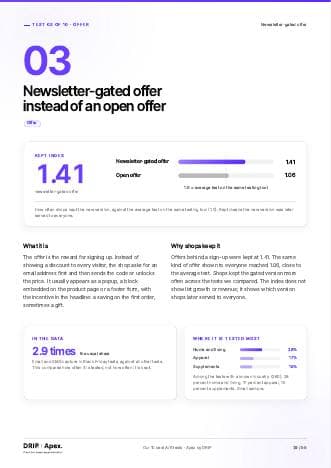
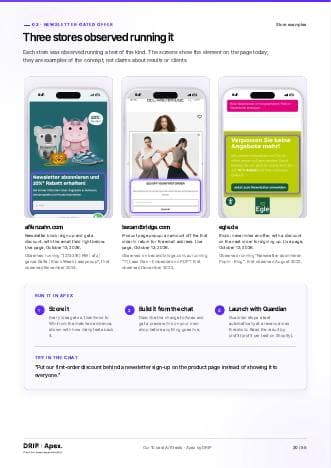
55 pages. Here are 25 of them.
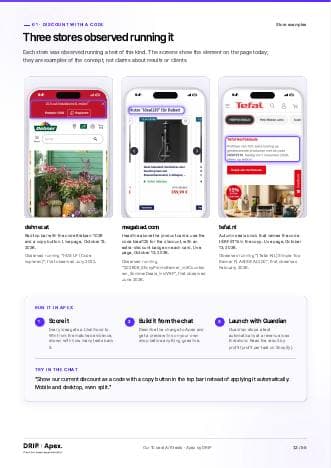
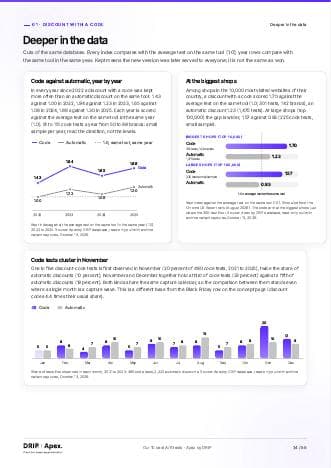
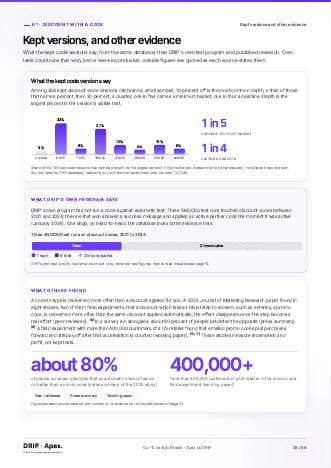
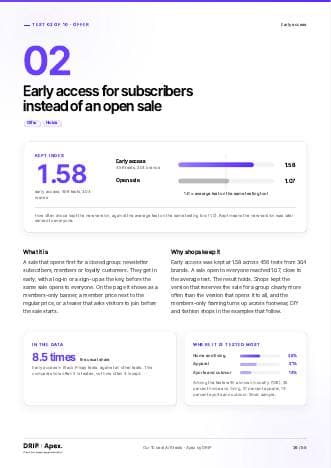
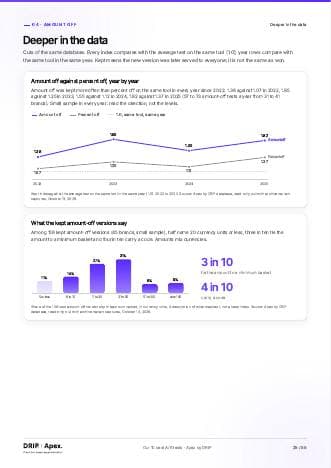
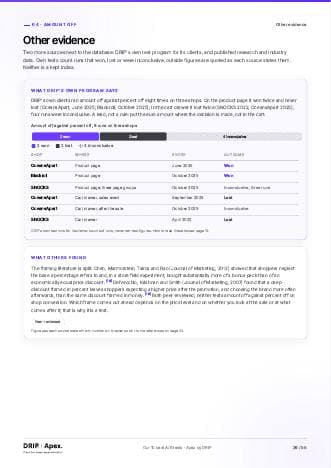
Every concept on four pages: the figures, three shops, the deeper data and evidence, and how to run it in Apex.
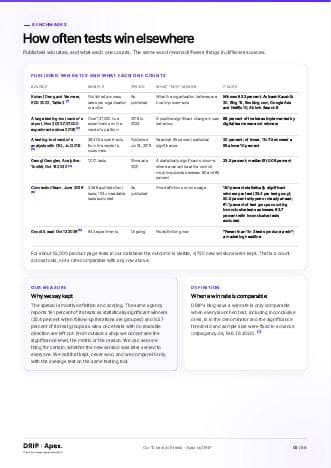
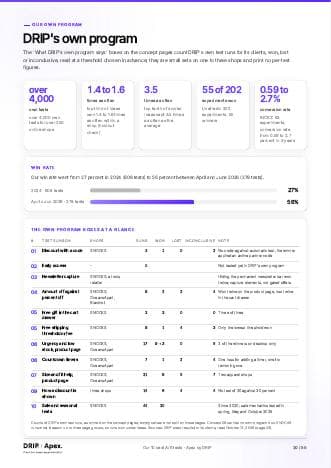
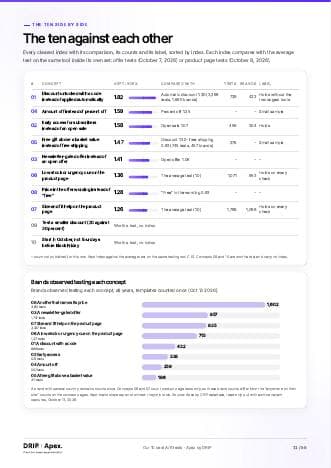
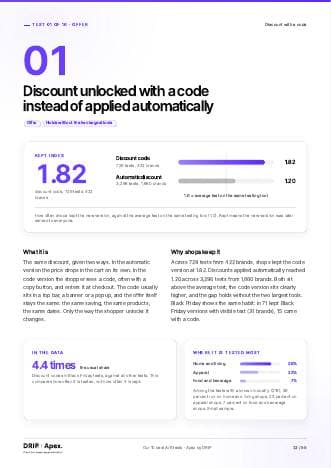
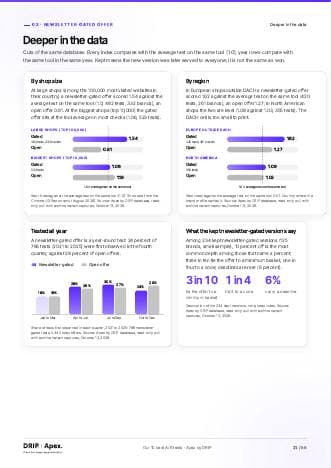
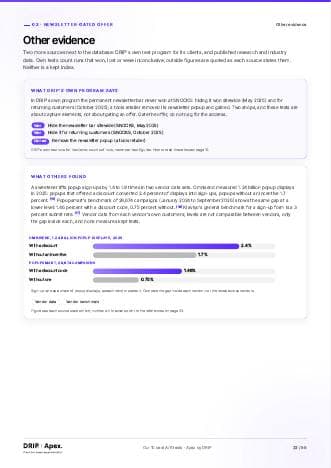
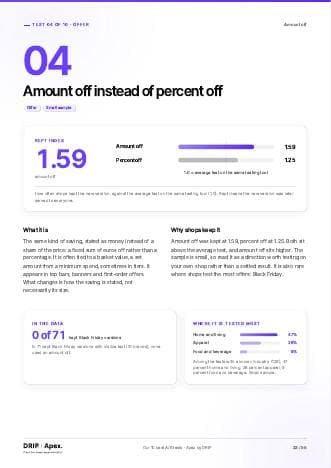
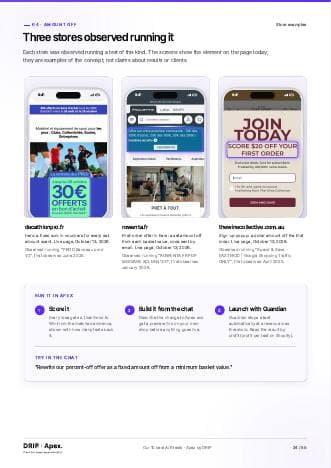
What you get
One PDF. Ten tests. The evidence behind each.
The 10 test concepts
Eight with their kept index against the average test on the same testing tool, two worth running from the Black Friday data, and where each is tested most by industry.
Three shops per test
Three online shops observed running each concept, in phone renders, with the record behind every example.
How to run each test in Apex
Every concept as a ready test idea: its Likelihood to Win for your shop, built from the chat, watched by Guardian.
The problem
Why most A/B tests do not win
The ten tests in this PDF start from what shops actually tested and kept.
Testing what everyone tests
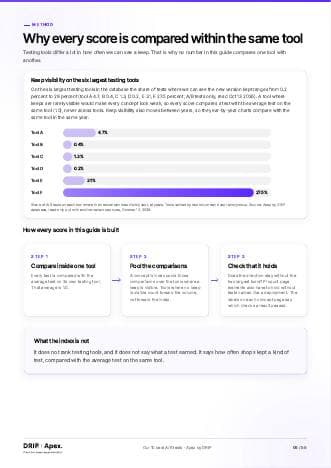
Trust badges, FAQ tabs, the usual suspects. In our database, trust badges and payment icons were kept at 0.81 and FAQ and tabs at 0.72, against the average test on the same testing tool (1.0).
Building tests that lose
Only 10 to 20 percent of experiments win, per Ronny Kohavi. Every test that loses still costs design, development and weeks of your traffic.
No way to know the odds before you build
A result arrives after the traffic is spent. Without the odds up front, the backlog runs on opinion.
The ten
The ten tests at a glance
The concepts, the shops and the how-to are in the PDF.
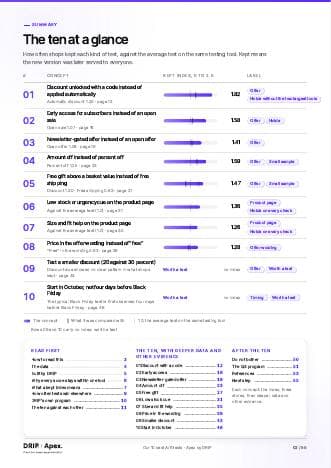
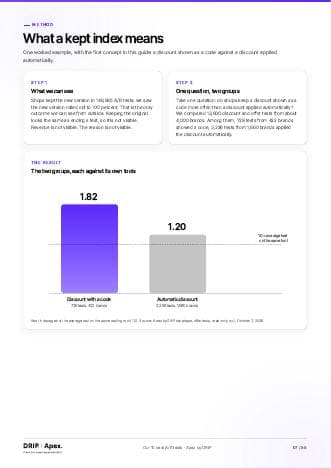
- 01Discount unlocked with a code instead of applied automatically1.82
- 02Early access for subscribers instead of an open sale1.58
- 03Newsletter-gated offer instead of an open offer1.41
- 04Amount off instead of percent offSmall sample1.59
- 05Free gift above a basket value instead of free shippingSmall sample1.47
- 06Low stock or urgency cue on the product page1.36
- 07Size and fit help on the product page1.26
- 08Price in the offer wording instead of “free”1.28
- 09Test a smaller discount (20 against 30 percent)Discount size showed no clear pattern in what shops kept.Worth a test
- 10Start in October, not four days before Black FridayThe typical Black Friday test is first observed four days before Black Friday.Worth a test
Index: how often shops kept the new version, against the average test on the same testing tool (1.0). Rows 9 and 10 are tests worth running from the Black Friday data, without an index.
FAQ
Questions before you download
What does “kept” mean?
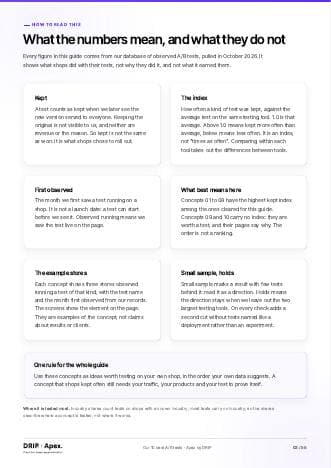
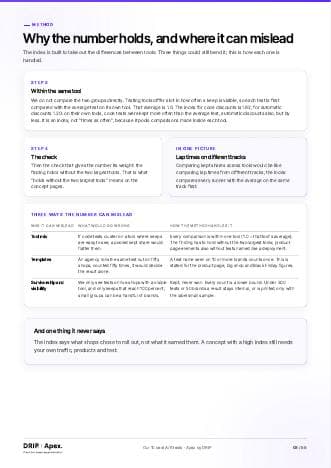
A test counts as kept when we later saw the new version served to every visitor. Revenue and the reason behind the decision are not visible to us, so we say kept, never won. Each index compares how often a kind of test was kept with the average test on the same testing tool (1.0).
Where does the data come from?
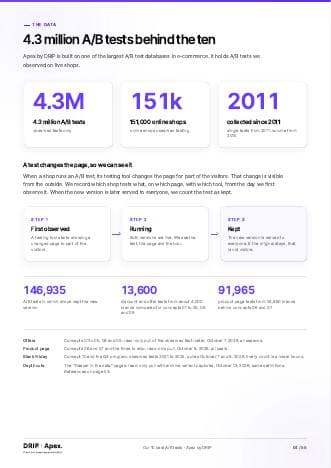
From observed tests. Every A/B test changes the page that real visitors see, so it runs in public. We have observed 4.3 million A/B tests from 151,000 online shops, collected since 2011: one of the largest A/B test databases in e-commerce.
Is this for my shop?
It is written for online shops with six-figure monthly revenue, on any platform. If you want to run the tests in Apex, Shopify and Scayle work out of the box.
What happens after the download?
You download the PDF on the next screen. Nothing else happens unless you book a demo. If you do, we score these ten tests for your shop live in the call.
Is it free?
Yes. The PDF is free.
Your next ten tests, with the evidence behind each
The ten concepts, three shops per test and how to run each one in Apex.